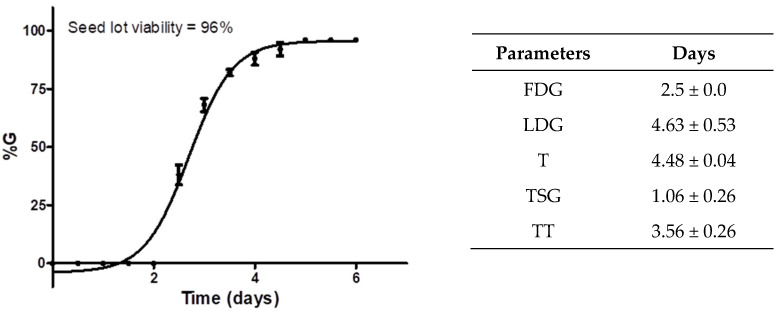
Figure 5.
Cucumber seed germination parameters were calculated according to a previous phytotoxicity assay. The graph shows the germination percentage (%G) of the seed lot of C. sativus against germination days, lot viability, and calculated germination factors. Each point in the graph represents the %G ± standard deviation (n = 50) against time (days).

