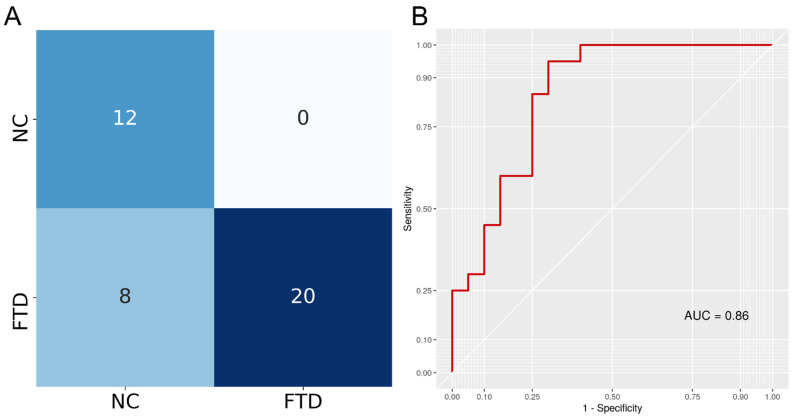
Figure 3.
(A) The confusion matrix indicates classification results for both classes. Rows indicate true labels and columns indicate predicted labels. (B) Receiver Operating Characteristic (ROC) curve of the DenseNet121 classifier obtained when predicting disease status (FTD/NC) using 3D T1w MRI. Area Under the Curve (AUC) was calculated as the definite integral between 0 and 1 on the x-axis and provides an aggregate measure of performance.

