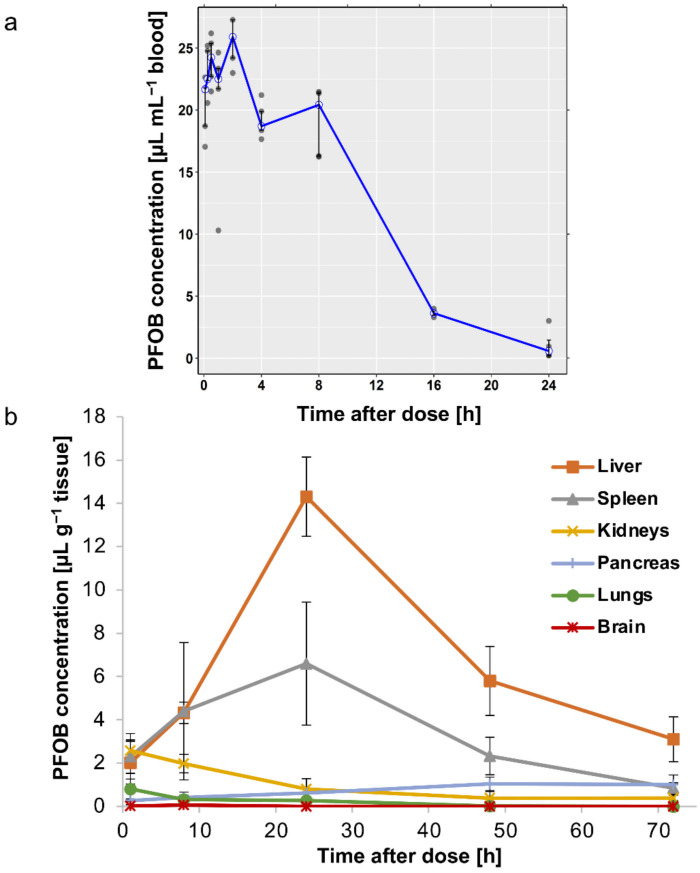
Figure 4.
In vivo pharmacokinetics and tissue distribution of nanodroplets in mice by PFOB determination by 19F-NMR. (a) Median (interquartile range) concentration–time profile of PFOB in blood on linear scale, overlaid with observed data points, after blood sampling 5, 15, 30, 60 min, 2, 4, 8, 16 and 24 h following a retro-orbital i.v. administration of a single dose of 300 µL of the concentrated emulsion. (b) Biodistribution profile of PFOB in liver, spleen, kidneys, brain, lung and pancreas 1, 8, 24, 48 and 72 h after a retro-orbital i.v. injection of a single dose of 300 µL of the concentrated emulsion. Data are expressed as mean ± SD (n = 5).

