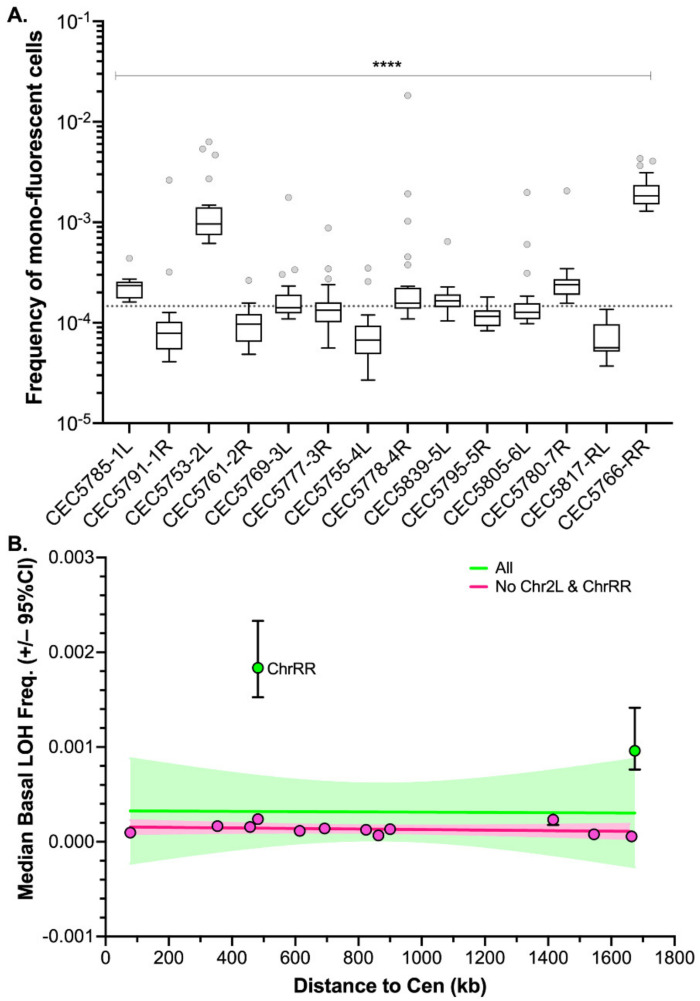
Figure 3.
Median basal LOH frequencies across 14 C. albicans genomic loci. (A) Box plot and whiskers (Tukey) of median basal LOH frequencies obtained upon fluctuation analysis using the Blue-Green collection (n = 24 parallel cultures). The median basal LOH frequency of the 14 genomic loci is represented by the gray dashed line. Significant differences between medians were assessed using the Kruskal–Wallis test (**** p < 0.0001). (B) Relationship between median basal LOH frequency (error: 95% CI) and the distance between the BFP/GFP LOH reporter system and the centromere (CEN) (kb). Linear regression of all 14 loci represented in green (Pearson’s R = −0.0149, p = 0.962114) and of 13 loci (without ChrRR possession rDNA locus) represented in pink (Pearson’s R = 0.3826, p = 0.19696).

