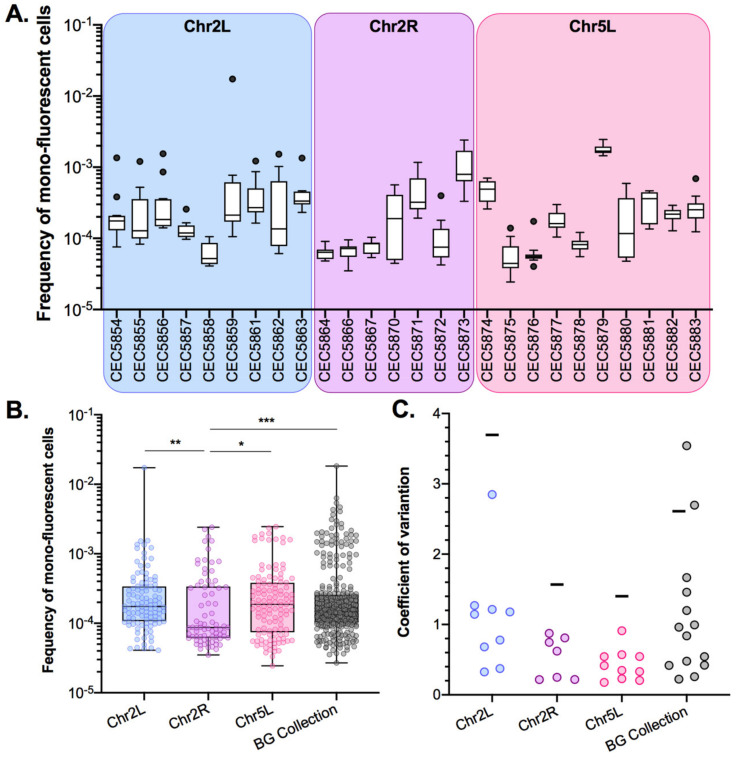
Figure 5.
Inter-strain heterogeneity of basal LOH frequency. (A). Median frequencies of mono-fluorescence in YPD, basal LOH frequencies, represented as box plots and whiskers (Tukey) were assessed by fluctuation analysis (n = 12) for genomic loci: Chr2L (9 strains), Chr2R (7 strains), and Chr5L (10 strains). (B). Pooled frequency of mono-fluorescence for the three loci illustrated in the top panel (Chr2L, Chr2R, and Chr5L) and for the 14 strains and loci in the Blue-Green (BG) collection (Figure 2). Overall median frequencies were compared using the Mann–Whitney test, significant differences are shown on the graph * p < 0.05, ** p < 0.001 and *** p < 0.0001). (C). Variation of LOH frequencies is represented by the coefficient of variation, where circles represent a given strain while horizontal lines depict the variation between transformants.

