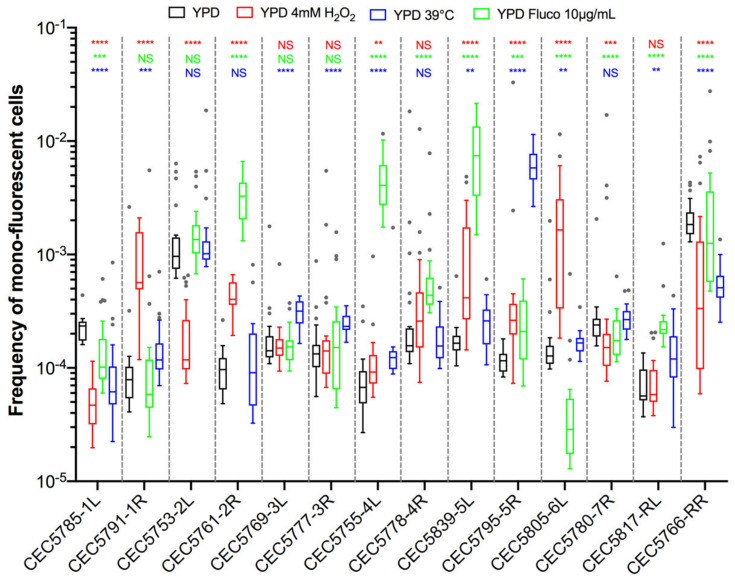
Figure 6.
LOH frequency of Blue-Green collection in growth conditions mimicking physiological stresses. Median frequencies of mono-fluorescence, LOH frequency, in YPD (black), 4 mM H2O2 (red), 10 µg/mL fluconazole (green), and growth at 39 °C (blue) represented as box plots and whiskers (Tukey). LOH frequencies were assessed by fluctuation analysis (n = 24) for 14 strains representing fourteen genomic loci (14 strains). Differences of median LOH frequencies, between control condition (YPD) and each stress condition were evaluated using the Mann–Whitney test (NS p > 0.05, ** p < 0.01, *** p < 0.001, and **** p < 0.0001).

