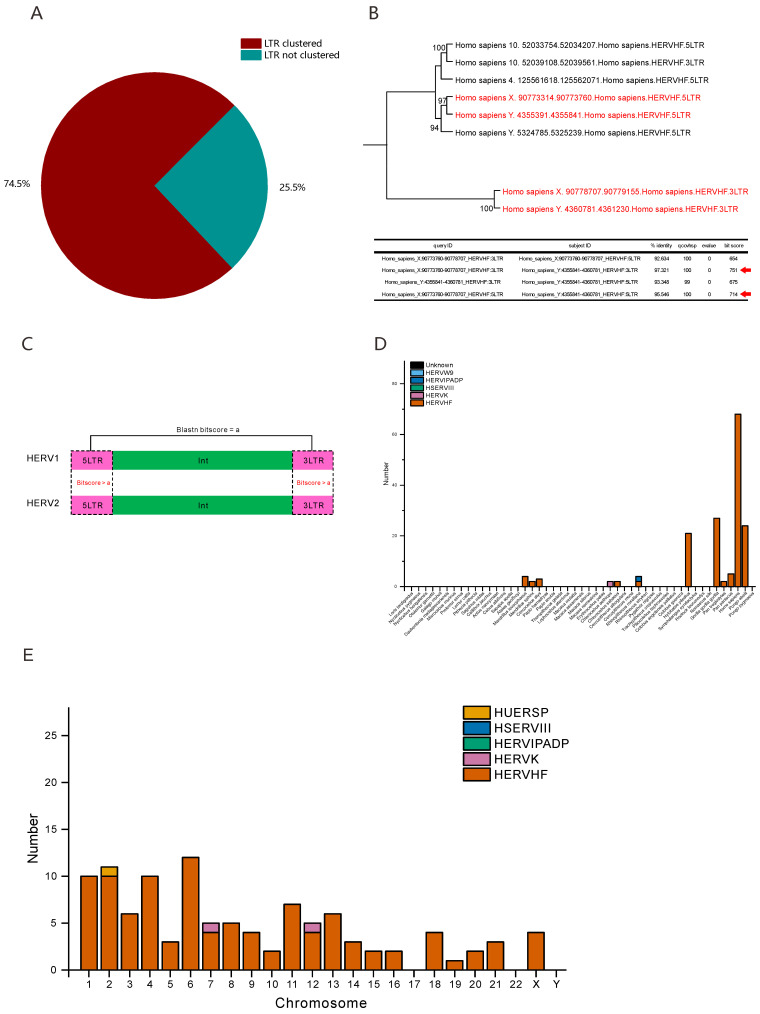
Figure 2.
F-HERVs may be involved in host genomic recombination or transcribed into ncRNAs. (A) The pie chart shows the number of F-HERVs with clustered LTRs (dark red) and HERVs with non-clustered LTRs (blue green). (B) The phylogenetic tree (upper) shows an example of LTR separation in one F-HERV-H of humans. The separation of the two LTRs is indicated in red, and ultrafast bootstrap approximation (UFBoot) values over 95 are provided beside the nodes. The BLASTN results of these two pairs of LTRs are shown in the table (lower) together with the BLASTN results. “qcovhsp” indicates the coverage of the query, and the red arrows indicate better alignments. The detailed alignments are shown in the Supplementary Data. (C) The diagram shows the standards used to screen F-HERV-related host genomic recombination events. The pink boxes and green boxes represent the LTR sequences (5LTR or 3LTR) or internal sequences (int) of F-HERVs, respectively. The dashed boxes show the BLASTN searches that we performed and the thresholds of each search (in red). The details of the genomic rearrangement analysis are provided in the Materials and Methods. (D) Histogram showing the number of recombination-related F-HERVs in each species, and the classifications of the F-HERVs are indicated in different colors. “Unknown” represents F-HERVs that cannot be classified according to their phylogenetic relationships with reference sequences or the similarity of their RT domains with reference RT sequences. (E) Histogram showing the number of F-HERVs that share the same locations and orientations with known ncRNAs on each human chromosome. The classifications of the F-HERVs are indicated in different colors.

