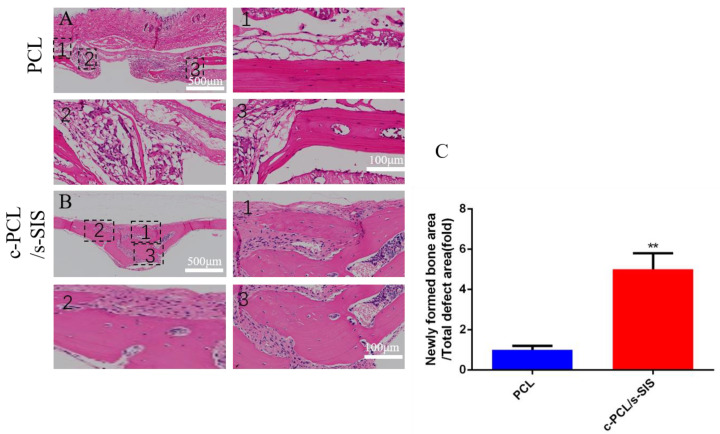
Figure 7.
Histological analysis of H&E staining at 8 weeks of (A) the PCL group or (B) the c-PCL/s-SIS group (the other images represent higher magnification images of the corresponding black square boxes in the first image). (C) Quantification of (A,B). n = 5; ** p < 0.01.scale bar: 500 μm and 100 μm.

