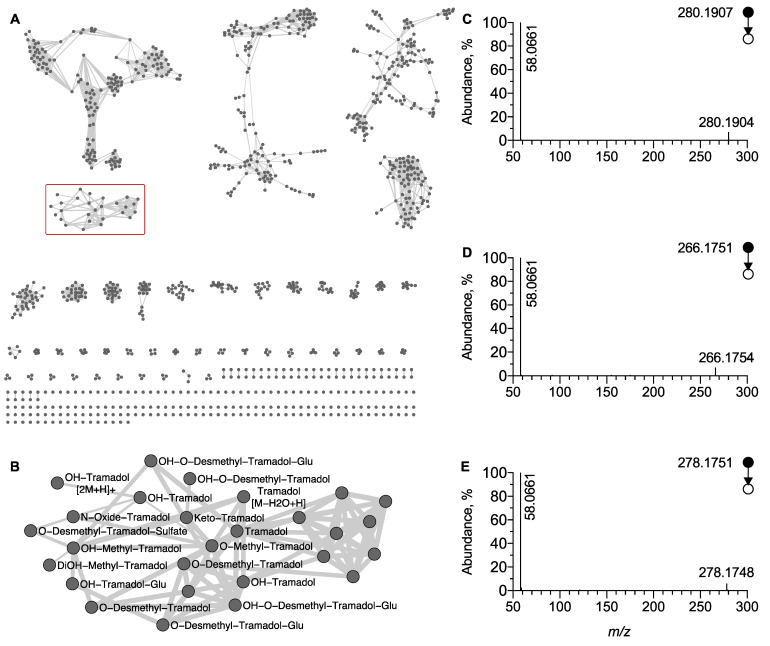
Figure 3.
Molecular network generated under positive ion mode. (A) Global overview and (B) focus on the cluster of tramadol-related metabolites (C1 displayed as redbox). MS/MS spectra of [M + H]+ ion corresponding to (C) OH-tramadol, (D) O-desmethyl tramadol, and (E) keto tramadol, respectively. The peak at m/z 58.0660 displayed on each MS/MS spectra facilitated the clustering in the MN.

