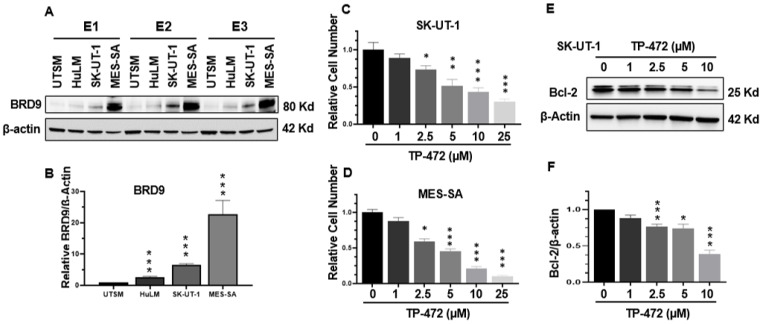
Figure 3.
The protein levels of BRD9 in UTSM, HuLM, MES-SA, and SK-UT-1 cell lines and iBRD9 treatment. (A) The protein levels of BRD9 were measured by Western blot. E1, E2, and E3 represent three experiments (B) The protein levels of BRD9 were quantified using NIH Image J software. β-actin was used as an endogenous control. (C) Cell proliferation in SK-UT-1 cells in the presence or absence of TP-472; (D) Cell proliferation in MES-SA cells in the presence or absence of TP-472. (E) Bcl-2 levels in SK-UT-1 cells in the presence or absence of TP-472 measured by WB. (F) Quantitative analysis of Figure 3E using NIH Image J software. Three independent experiments were performed. * p < 0.05, ** p < 0.01, *** p < 0.001 compared between treated groups and control.

