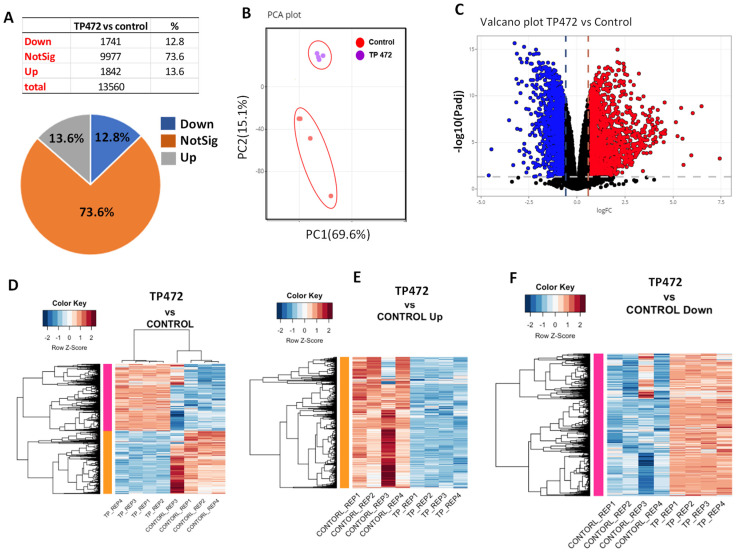
Figure 4.
BRD9 inhibition causes extensive changes in the transcriptome of uLMS cells. (A) Pie chart showing the percentage of genes that exhibited changes in RNA expression between TP-472 and vehicle treatment groups as determined by RNA-seq. The cutoff value is 1.5-fold with an FDA < 0.05. (B) PCA plot of BRD9/inhibitor (TP-472) and vehicle control (DMSO), (C): Volcano plot showing the distribution of the DEGs between TP-472 and vehicle-treated SK-UT-1 cell line. The dashed line indicates the p-value significance threshold. (D) Heat map. Pearson correlation was used to cluster DEG (TP-472 vs. Control), which were then represented as a heatmap with the data scaled by Z score for each row. (E) Heat map. Pearson correlation was used to cluster DEG (TP-472 vs. Control, up genes), which were then represented as a heatmap with the data scaled by Z score for each row. (F) Heat map. Pearson correlation was used to cluster DEG (TP-472 vs. Control, down genes), which were then represented as a heatmap with the data scaled by Z score for each row.

