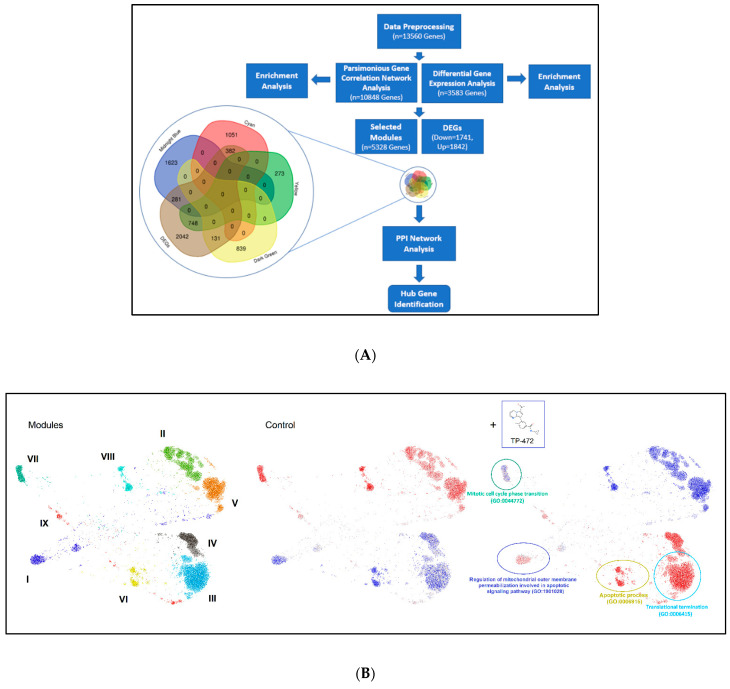
Figure 7.
Network representation of the modular pattern of gene expression during the transition of control to TP-472 treatment. (A) Flowchart of modular pattern analysis, (B) Left: Nine network modules are color coded. Middle and right: Overlay of gene expression z-scores for all genes in the control and TP-472 conditions shown in blue (low) to red (high) z-score color scale. Four constructed modules, including mitotic cell cycle phase (GO: 0044772), regulation of mitochondrial outer membrane permeabilization involved in apoptotic signaling pathway (GO:1901028), apoptotic process (GO: 9996915), and translational termination (GO: 0006415) were enriched and highlighted. Note: Greek numerals are the index for Modules.

