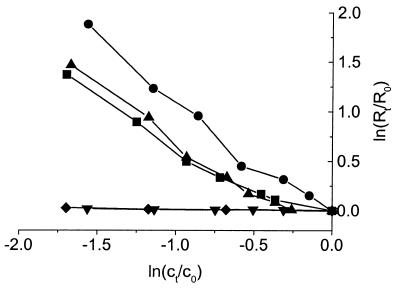
FIG. 4.
D/H isotope fractionation during degradation of various combinations of selectively deuterated toluene species. Representative curves from three replicates are shown for D. cetonicum grown with equal amounts of toluene-d8 and toluene-d5 (▪), with toluene-d3 and nonlabeled toluene (●), with toluene-d8 and nonlabeled toluene (▴), with toluene-d5 and nonlabeled toluene (⧫), and with toluene-d8 and toluene-d3 (▾). The curves were plotted by using equation 2.

