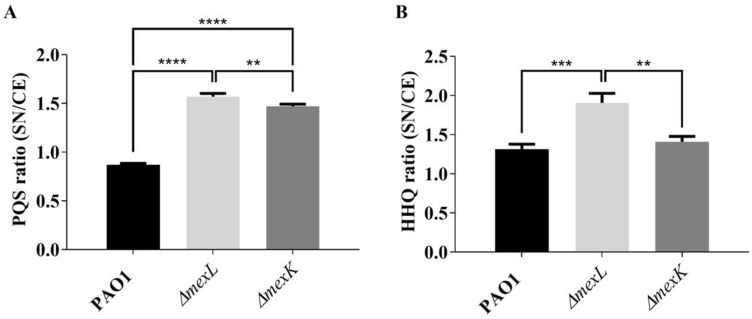
Figure 6.
Determination of the ratio supernatant/cell extract (SN/CE) of PQS and HHQ. The TLC-spots corresponding to (A) PQS and (B) HHQ were quantified by densitometry using the ImageJ software, and the ratio between the HHQ and PQS present in the supernatant with respect to cell extract was calculated. The results showed that, although ΔmexL presented a higher PQS and HHQ ratio with respect to PAO1, only the HHQ ratio could be interpreted as a consequence of efflux pump overexpression. Values that are significantly different by an unpaired two-tail t-test are indicated by asterisks as follows: ** p < 0.01; *** p < 0.001; **** p < 0.0001.

