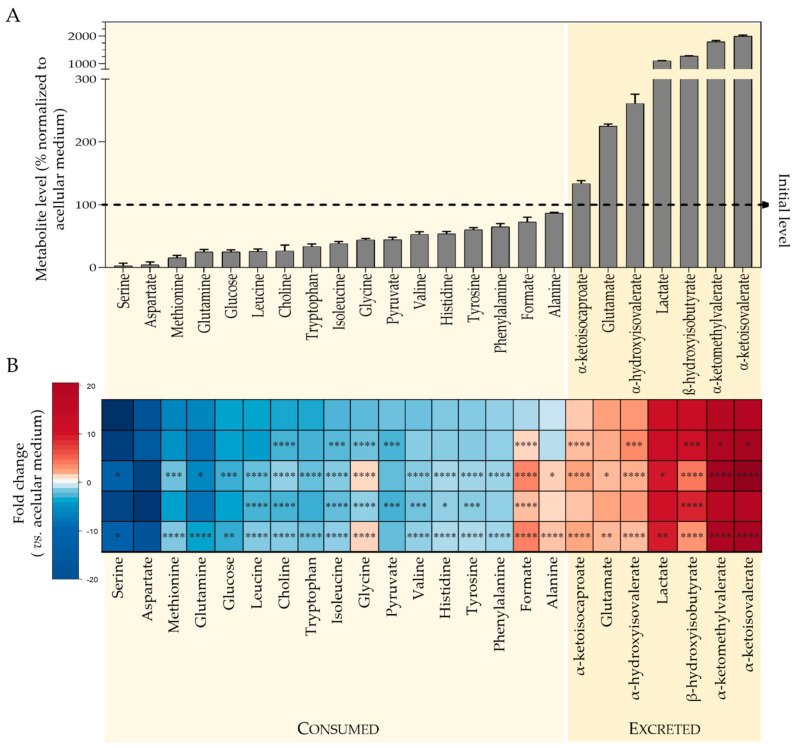
Figure 3.
Results of metabolic profiling of culture medium. (A) Metabolite levels in the medium of control cells normalized to acellular medium: for each metabolite, the signal area in the medium resulting from incubating cells for 24 h was divided by the signal area in the acellular medium (set to 100%, dashed line); hence, metabolites with levels below 100% were consumed by cells, whereas metabolites with levels above 100% were excreted. (B) Heatmap colored according to fold change (FC) in cells-conditioned medium vs. acellular medium, showing the comparison for control cells and cells exposed for 24 h to IC10 or IC50 concentrations of articaine (ATC10 and ATC50, respectively) and to IC10 or IC50 concentrations of lidocaine (LDC10 and LDC50, respectively). Metabolites consumed show negative FC (blue scale), while metabolites excreted display positive FC (red scale). The color intensity reflects the magnitude of consumption/excretion. Statistical significance was assessed in respect to controls using the t-test (* p < 0.05; ** p < 0.01; *** p < 0.005; **** p < 0.001).

