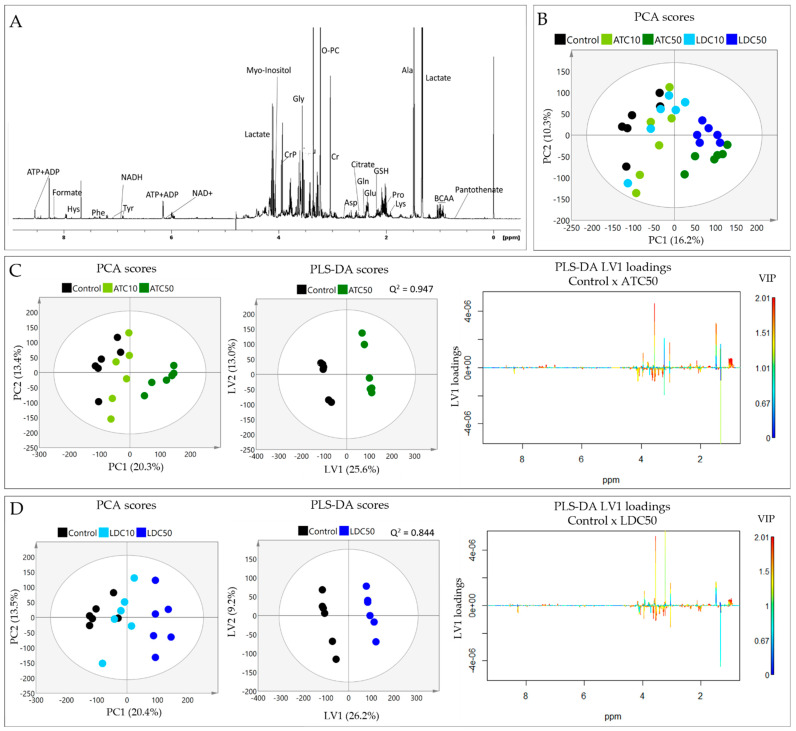
Figure 4.
Results of metabolic profiling of cell aqueous extracts. (A) 1D 1H-NMR spectrum of a polar extract of SH-SY5Y control cells, with some assignments indicated (three-letter codes used for amino acids; ATP/ADP, adenosine tri/di-phosphate; BCAA, branched chain amino acids; NAD, nicotinamide adenine dinucleotide; PC, phosphocholine; PCr, phosphocreatine). (B) Principal Component Analysis (PCA) scores scatter plot of the five sample groups compared (control and exposed to IC10 and IC50 concentrations of ATC or LDC). (C) PCA and Partial Least Squares Discriminant Analysis (PLS-DA) of (C) control and ATC-exposed cells, (D) control and LDC-exposed cells: PCA scores scatter plot (left) showing the separation between control, IC10 and IC50; PLS-DA scores scatter plot (middle) showing the discrimination between control and IC50-exposed cells; PLS-DA LV1 loadings plot (right) colored according to variable importance to the projection (VIP), showing the spectral signals responsible for group discrimination.

