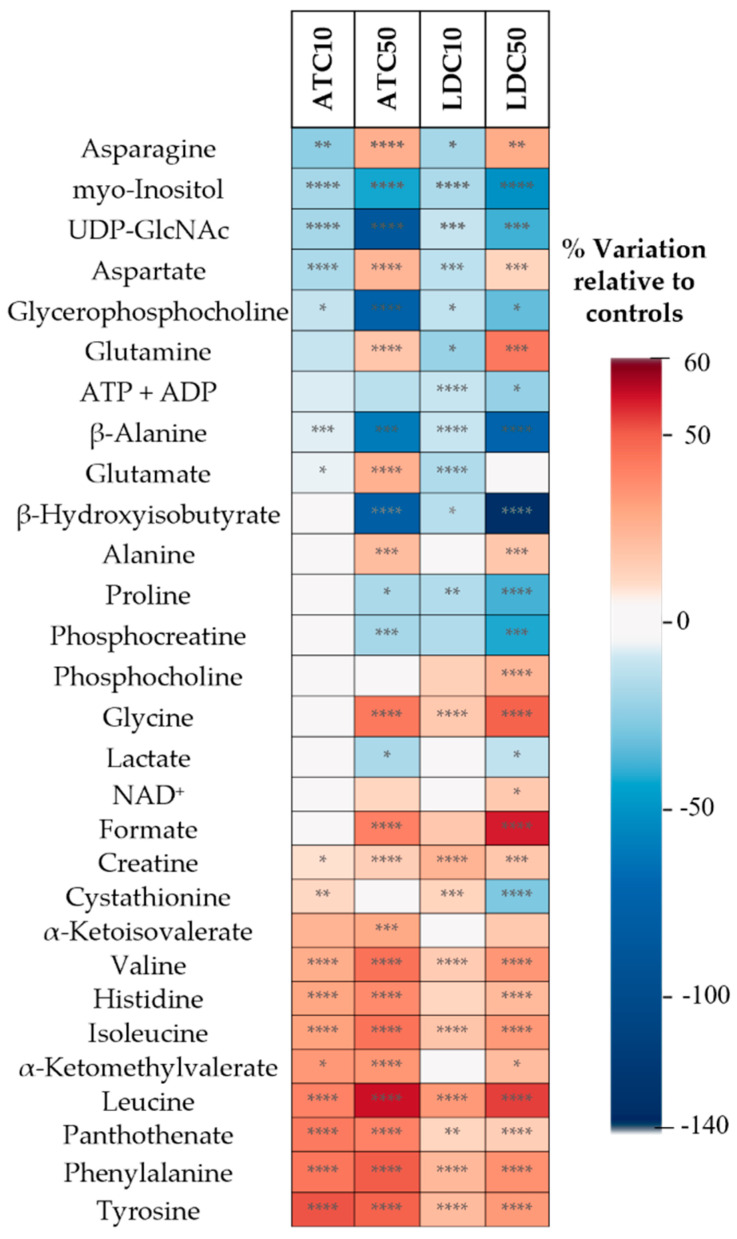
Figure 5.
Heatmap summarizing the metabolic variations detected by NMR analysis of aqueous extracts, as assessed by spectral integration. The color scale represents the % variation in ATC- or LDC-exposed cells (at IC10 and IC50 concentrations) in relation to untreated controls. Hence, metabolites with lower levels in LA-exposed cells than in untreated controls show negative variations (blue color), while metabolites increased in exposed cells relative to controls display positive variations (red color). Statistical significance was assessed in respect to controls using the t-test (* p < 0.05; ** p < 0.01; *** p < 0.005; **** p < 0.001). ADP, adenosine diphosphate; ATP, adenosine triphosphate; NAD, nicotinamide adenine dinucleotide; UDP-GlcNAc, uridine diphosphate N-acetylglucosamine.

