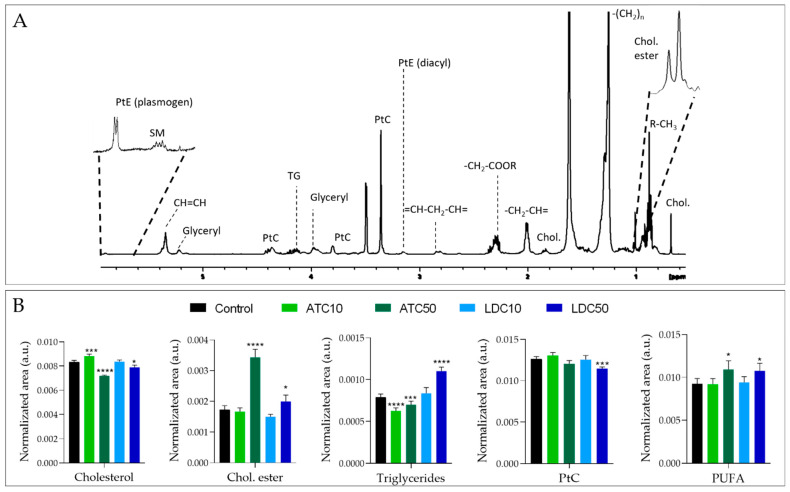
Figure 6.
Results of metabolic profiling of cell lipid extracts (A) 1D 1H NMR spectrum of an apolar extract of SH-SY5Y control cells. (B) Relative levels of some lipid classes, obtained by spectral integration and normalization to total area, in control samples and in cells exposed to ATC or LDC at the IC10 or IC50 concentrations. Statistical significance was assessed in respect to controls using the t-test (* p < 0.05; *** p < 0.005; **** p < 0.001). Chol, cholesterol; Chol ester, cholesteryl esters; PtC, phosphatidylcholine; PtE, phosphatidylethanolamine; PUFA, polyunsaturated fatty acyl chains; SM, sphingomyelin; TG, triglycerides.

