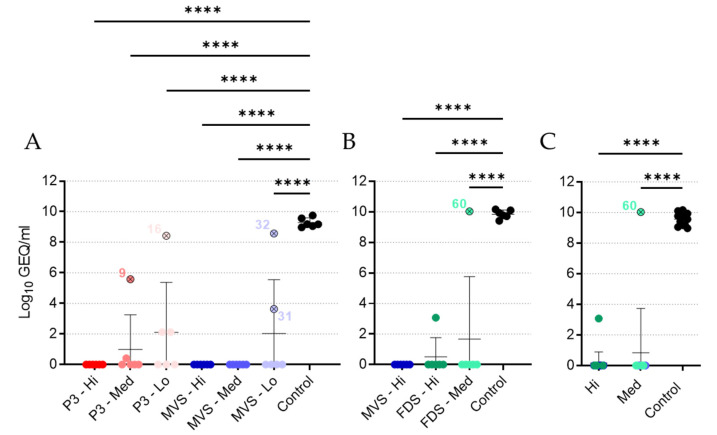
Figure 4.
Viremia following GPA-MARV challenge. Blood samples obtained from all guinea pigs at 5 days post-infection (DPI) in Experiment #1 (A) or Experiment #2 (B) were assessed for levels of virus RNA via RT-qPCR. Data are presented as Log10 genome equivalents (GEQ) per milliliter, with means and standard deviations for each group depicted behind individual values for each animal. Data from the high and medium dose levels for the PHV01 MVS and PHV01 FDS groups were pooled to assess dose-dependent effects (C). Vaccinated animals that did not survive infection are indicated with an “x” and labelled with the animal number. Note that a technical error meant that animal 9 did not receive the full vaccine dose. All vaccinated groups showed significant differences compared to controls (****, p ≤ 0.0001).

