
FIGURE 3.
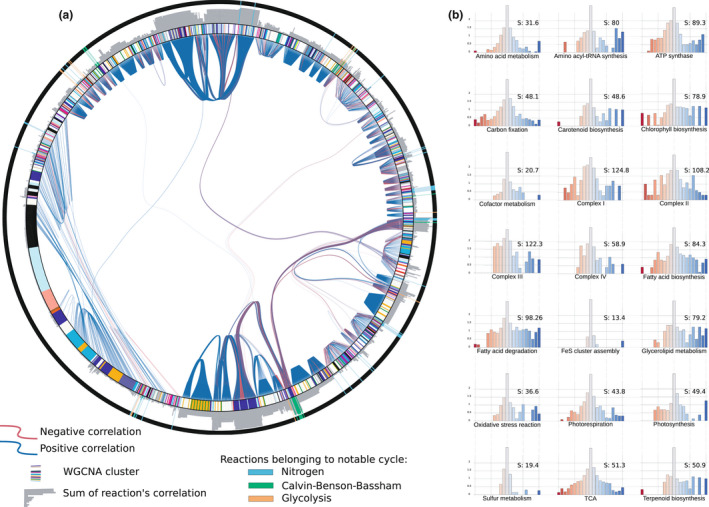
Correlation between Phaeodactylum reactions to support the metabolic niche. (a) Description of most significant dependencies between metabolic reactions. Metabolic reactions are ordered in an outer circle. Reactions associated with nitrogen, Calvin–Benson–Bassham and glycolysis cycles are emphasised. An edge between reactions corresponds to a correlation (positive or negative) between two fluxes’ reactions above 0.6. The inner‐circle describes WGCNA modules to which the gene associated with the reaction belongs. A grey circular bar plot shows the correlation sum of each reaction as a proxy of the reaction essentiality for the metabolic niche. (b) Shows essentiality of pathways for the metabolic niche. We represent the correlation histogram normalised by the number of genes present in the pathway for distinct pathways. Y‐axes are in log scale. The S score is the sum of the absolute correlation value of the histogram, which estimates pathway essentiality for the metabolic niche