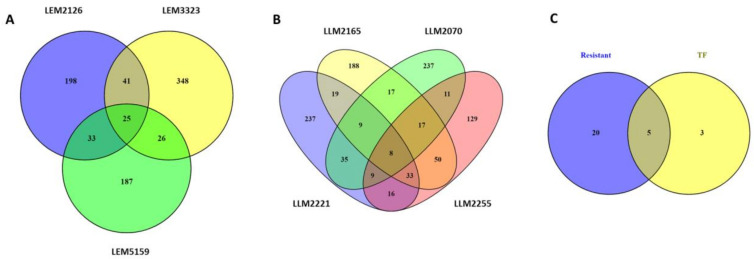
Figure 2.
Venn diagrams of differentially expressed genes (DEGs) in L. infantum lines after THP-1 infection. Venn diagrams of (A) resistant lines, (B) therapeutic failure (TF) lines, and the combination of both (C). The number of exclusive and common genes in each comparison, including total upregulated and downregulated DEGs, are represented.

