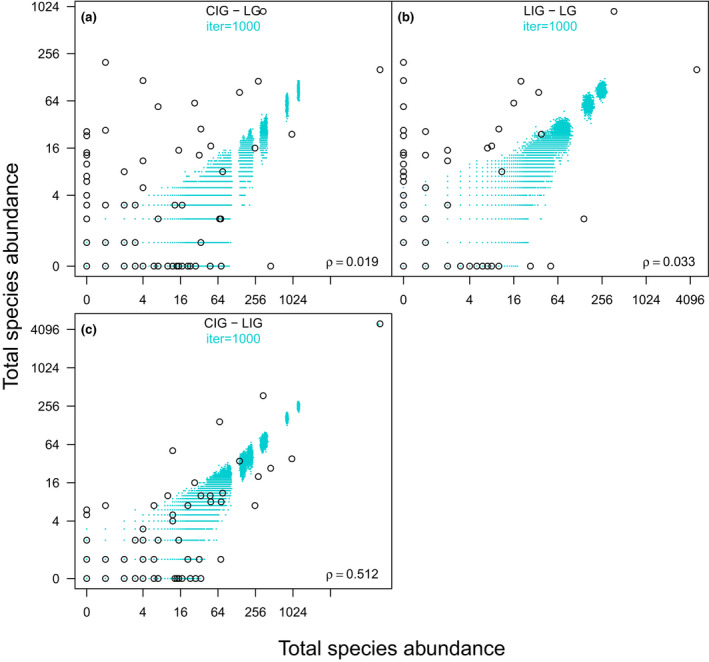
FIGURE 4.

Pairwise comparisons of species total abundances (total counts in pooled data from each interval). (a) Current interglacial and last late glacial (CIG‐LG, upper left panel, x‐axis: CIG, y‐axis: LG). (b) Pleistocene interglacial and last late glacial (LIG‐LG, upper right panel, x‐axis: LIG, y‐axis: LG). (c) Holocene and Pleistocene interglacials (CIG‐LIG, lower panel, x‐axis: CIG, y‐axis: LIG). Species total abundances have been log‐transformed. The output of the randomization model based on 1000 iterations highlights the portion of two‐dimensional space in which the points should fall under the null model of a homogenous system. Spearman's rank correlation (ρ) for each pairwise comparison is reported on each panel; it is significant only for the interglacial pairwise comparison (i.e., CIG‐LIG, p < .001; see also Table S6)
