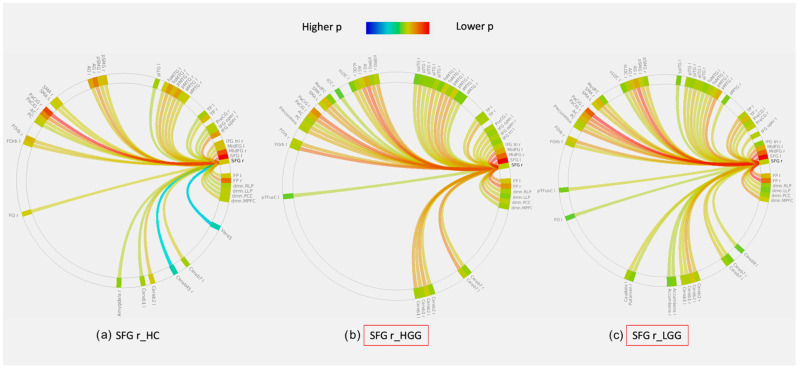
Figure 4.
Example of whole-brain connectivity diagrams generated by seeding of the right superior frontal gyrus (SFG r) in healthy controls (HC, (a)), left-hemispheric high-grade gliomas (HGG, (b)) and left-hemispheric low-grade gliomas (LGG, (c)). The red square in diagrams (b) and (c) indicates that there was a significant difference in functional connectivity in this seed for HGG and LGG compared to HC (a). The color scale of the links represents their statistical significance (p-value FDR corrected, only links with p < 0.05 are included). Regions of interest (ROI) in the diagrams are labeled as per the AAL atlas (available in CONN toolbox at https://web.conn-toolbox.org, accessed on 3 March 2022).

