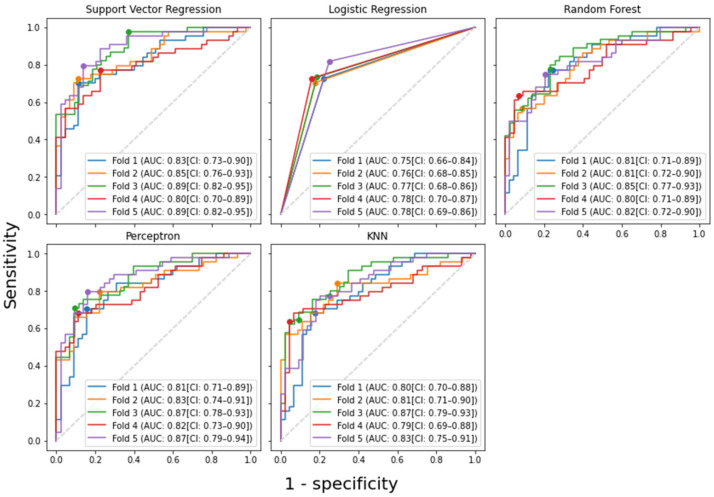
Figure 4.
The receiver operator characteristic (ROC) curves of various machine learning models in discriminating stage T1 nasopharyngeal carcinoma (NPC) from benign hyperplasia in fivefold cross validation using the features selected by the proposed-RENT. The 95% confidence interval (CI) of each ROC curve was computed by bootstrapping the data 1000 times. As logistic regression resulted in a binary output of either 0 (for benign hyperplasia) or 1 (for NPC), the ROC curve has only three points in each fold. The dots on the graphs correspond to where the maximum Youden index was achieved. Support vector regression obtained the highest mean AUC (0.850) among the five tested models. kNN = k-nearest neighbors, AUC = area under the ROC curve, CI = 95% confidence interval.

