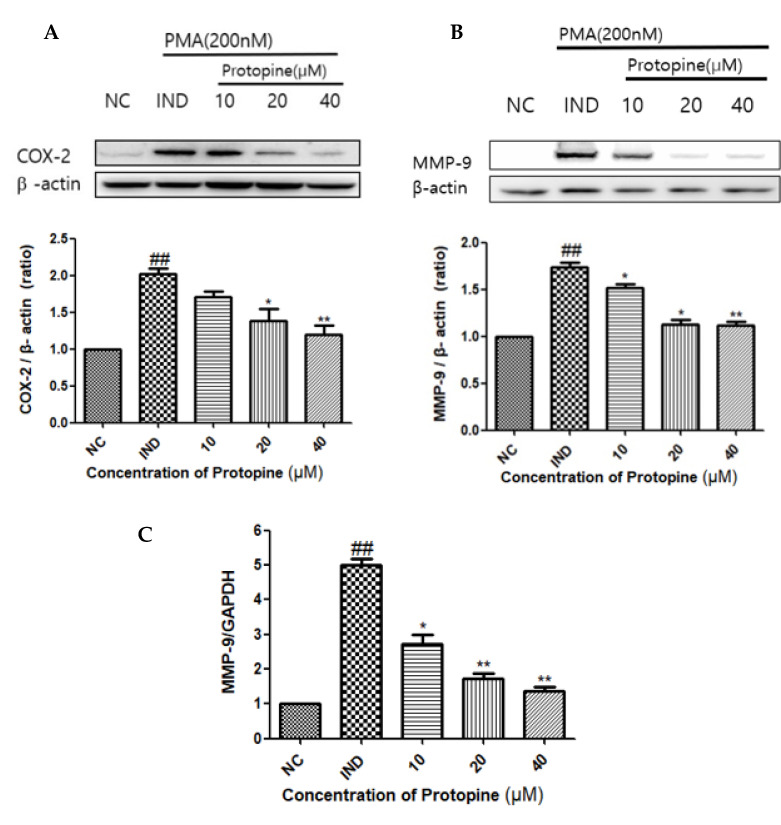
Figure 4.
Protopine regulated COX-2 and MMP-9 in PMA-stimulated HepG2 cells. (A) COX-2, confirmed by Western blot, increased expression during the PMA treatment and decreased in a concentration-dependent manner upon the protopine treatment. (B) MMP-9, confirmed by Western blot, increased the expression when treated with PMA, and showed a high inhibition rate when treated with 40 µM of protopine. (C) MMP-9 mRNA levels were determined by RT-PCR analysis. MMP-9 showed the highest inhibition rate even at the mRNA level when treated with 40 µM protopine. Results are presented as the mean ± SD. ## p < 0.01, indicating a significant difference from the control. * p < 0.05, ** p < 0.01, indicating a significant difference from the PMA group. NC, normal control; IND, inducer.

