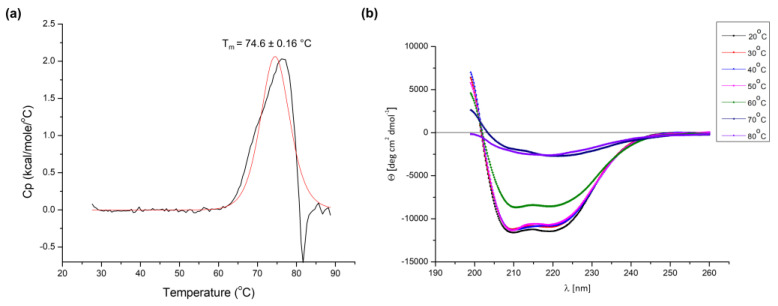
Figure 9.
Examination of the thermal stability of the Tt72 pol. (a) Tt72 pol’s heat-capacity curves were determined by differential scanning calorimetry (DSC) that was recorded in 20 mM Tris-HCl (pH 8.0) and 50 mM NaCl. The Tt72 pol (black line) and the fit to the two-state model (red line). (b) Changes in circular dichroism spectra during thermal denaturation of Tt72 pol. The CD spectra were recorded in 20 mM MES (pH 5.0) and 50 mM NaCl from 200 to 260 nm over a temperature range of 20–80 °C. Representative spectra are shown at specific temperatures during thermal denaturation.

