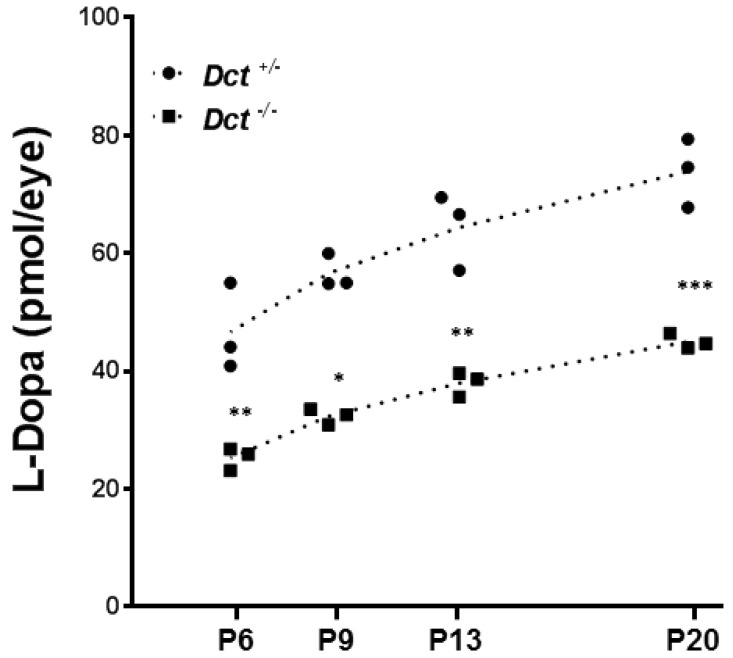
Figure 6.
Dosage of L-Dopa in postnatal eyecups. L-Dopa was quantified by HPIC in Dct−/− eyecups (square symbols)) compared to Dct+/− (black dots). Eyecups from Tyrc/c mice were used to define the baseline. At each indicated postnatal day: P6, P9, P13, P20, both eyes from 3 littermates of each genotype were dissected, pooled, and used for dosage. For each stage of development, L-Dopa quantification for both genotypes were compared by using unpaired t-test,* p < 0.05, ** p < 0.01; *** p < 0.001.

