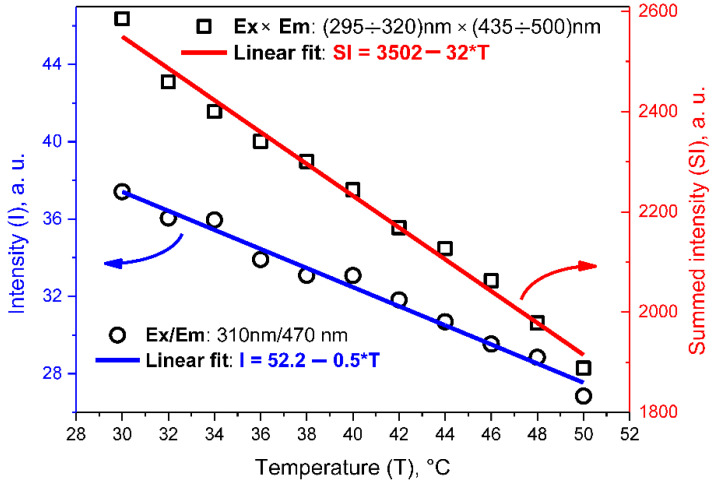
Figure 5.
Temperature-dependent PL intensity of colloidal solutions of O, N-CDs in water (0.625 g/L). Black symbols—experimental points. Blue and red lines are linear fits of the experimental points corresponding, respectively, to a single spectral point Exc/Em: 310/470 nm and a spectral area: Exc × Em: (295–320) nm × (435–500) nm.

