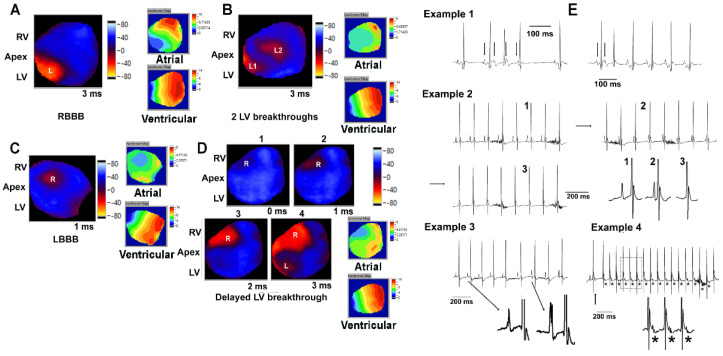
Figure 4.
Loss of Hand2 in embryonic CCS results in ventricular conduction defects and atrial arrhythmias. Snapshots of representative epicardial voltage maps obtained during right atrial pacing (cycle length, 120 ms) in isolated-perfused H2LVCreCKO or H2control hearts. Isochrone activation maps during atrial and ventricular pacing (cycle lengths, 120 ms) are also shown for each heart. Number below each snapshot image is time in ms with 0 being the time of first epicardial breakthrough. Color codes for snapshots are in arbitrary units. Please note that membrane depolarization causes a decrease in the dye’s fluorescence intensity. Color codes for the activation maps are in ms. R, right; L, left. (A) Right BBB, only left side epicardial breakthrough (L). (B) Two LV breakthrough sites (L1, L2). (C) LBBB, only right side epicardial breakthrough (R). (D) Several millisecond delay between RV and LV activation. (E) Examples of spontaneous arrhythmias in H2LVCreCKO mice. Example 1, left panel: short run of atrial tachycardia with Wenckebach-type AV conduction block (left; first arrow denotes sinus beat whereas the following three arrows indicate atrial premature beats exhibiting a P wave morphology that is distinctly different from that during sinus rhythm. The third premature beat is not conducted to the ventricles). Right: A sinus beat (first arrow) is followed by an atrial premature beat (second arrow) initiating a sustained atrial tachycardia. Note difference in P wave morphology before from that during tachycardia. Example 2: progressive shortening of PR interval until the P wave is eventually embedded in the QRS complex and undetectable on the ECG. The sinus node functions as a pacemaker for the atria but slowed conduction across the AV node allows a junctional pacemaker located between the AV node and the origin of the His bundle branches to emerge and drive the associated QRS complex, i.e., junctional rhythm. Left lower panel shows zoom-in views of the correspondingly numbered cycles in the low-resolution traces. Example 3: sudden change in P wave morphology, indicative of a competing ectopic atrial pacemaker. Example 4: sustained supraventricular tachycardia with 1:1 AV conduction. Asterisks (*) denote P waves. The tachycardia is initiated by an atrial premature contraction (arrow). Lower trace shows zoom-in views of 3 consecutive cycles framed by the dotted box.

