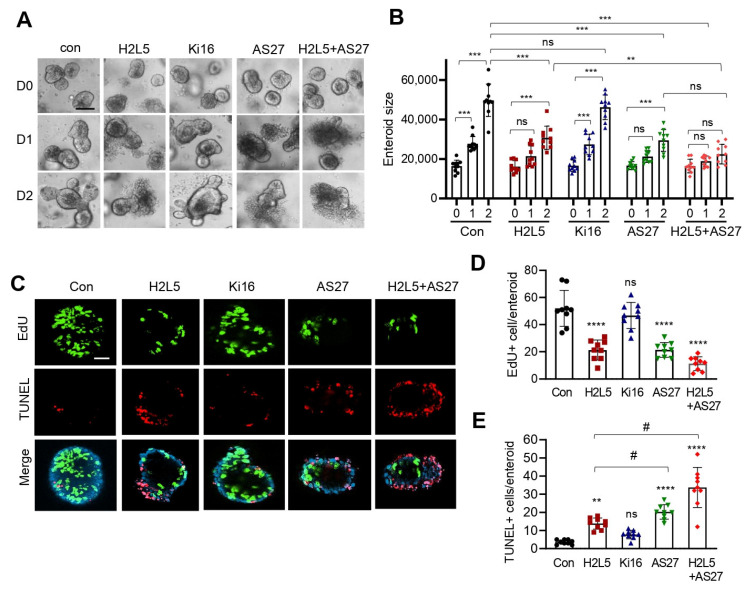
Figure 4.
The growth of WT enteroids is suppressed by inhibition of LPA2 and LPA5. (A) Representative images of Lpar5f/f enteroids treated with LPA2 inhibitor H2L5186303 (H2L5), LPA1/LPA3 inhibitor Ki16425 (Ki16), LPA5 inhibitor AS2717638 (AS27), or H2L5+AS27 are shown. Data are representative of 3 experiments. Scale bar = 50 µm. (B) The growth of Lpar5f/f enteroids was quantified by determining the area of enteroids using ImageJ. All data are presented as mean ± SD. n = 10. ** p < 0.01, *** p < 0.001, ns = not significant by two-way ANOVA with Tukey’s multiple comparison test. (C) Representative images of EdU and TUNEL staining in Lpar5f/f enteroids treated with inhibitors are shown. Representative of three independent experiments. Bar = 50 µm. Quantification of EdU+ (D) and TUNEL+ **** p < 0.0001, ns = not significant compared to Con. (E) enteroid. n = 10. ** p < 0.01, **** p < 0.0001, ns = not significant compared to Con. # p < 0.0001.

