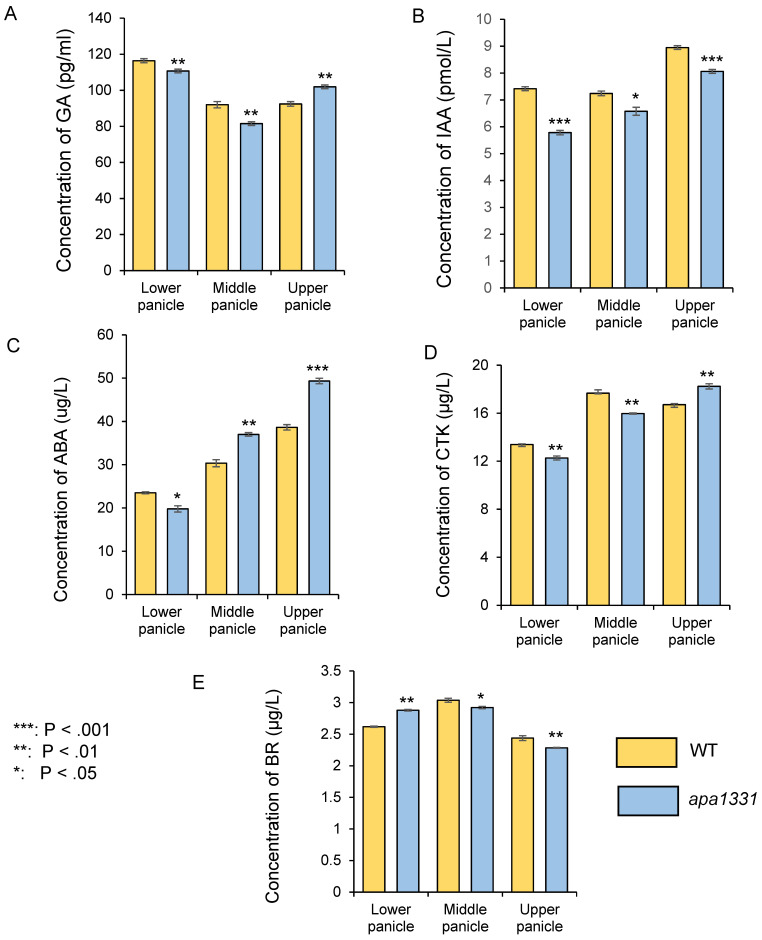
Figure 1.
Comparative analysis of phytohormones in different parts (lower, middle, and upper) of the 6 cm panicle wild type (yellow) and apa1331 (blue); gibberellic acid (A); indole 3 acetic acid (B); abscisic acid (C); cytokinin (D); and brassinosteroids (E). A Student’s t-test was used to analyze the significance of data, presented as mean ± standard deviation, where asterisks *, **, and *** show that p < 0.05, p < 0.01, and p < 0.001, respectively.

