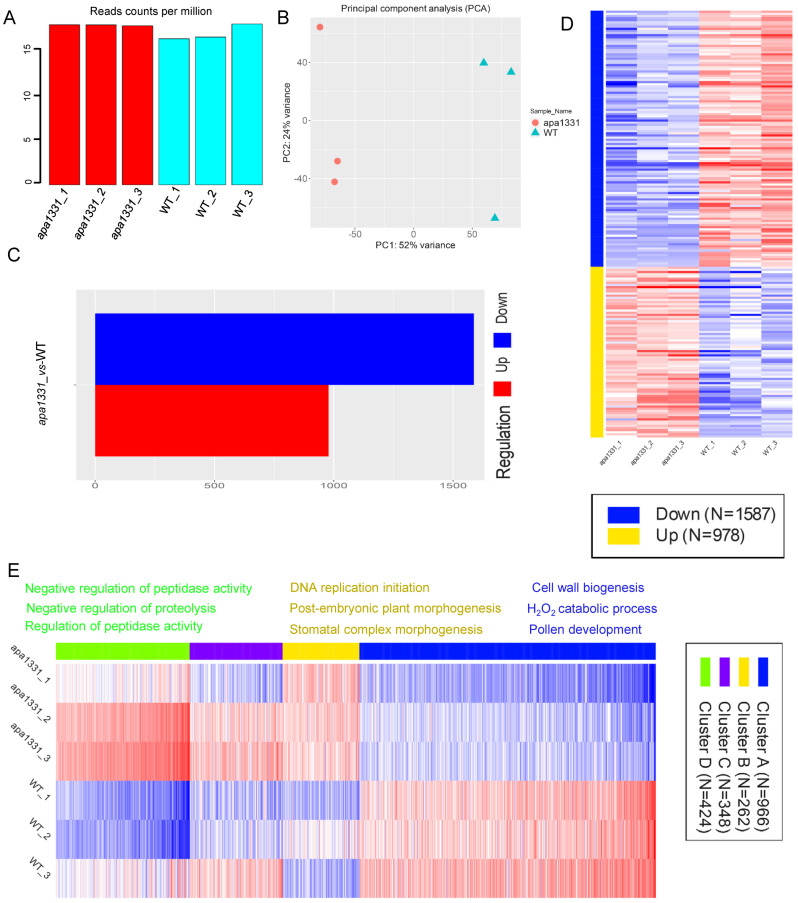
Figure 2.
Identification of DEGs in WT and apa1331. Read counts per million (A); principal component analysis (B); difference between the number of up- and downregulated genes (C); heat map displaying the clustering analysis of DEGs in up and downregulation (D); heat map displaying the expression of DEGs based on k-means enrichment analysis (E).

