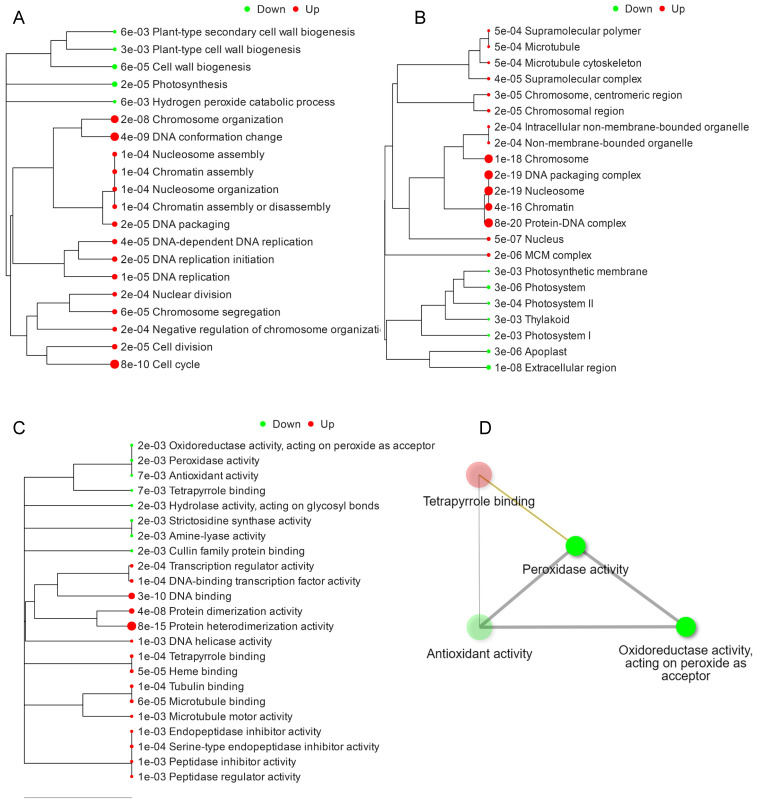
Figure 3.
Hierarchical clustering based on GO functional analysis. GO biological processes (A); GO cellular processes (B); GO molecular functions associated with DEGs (C); and GO terms network interaction analysis of DEGs (D). DEGs were subjected to design hierarchical clustering trees using iDEP 0.951, with parameters: most variable genes to include—2000, number of clusters—4, and normalize by gene—mean center.

