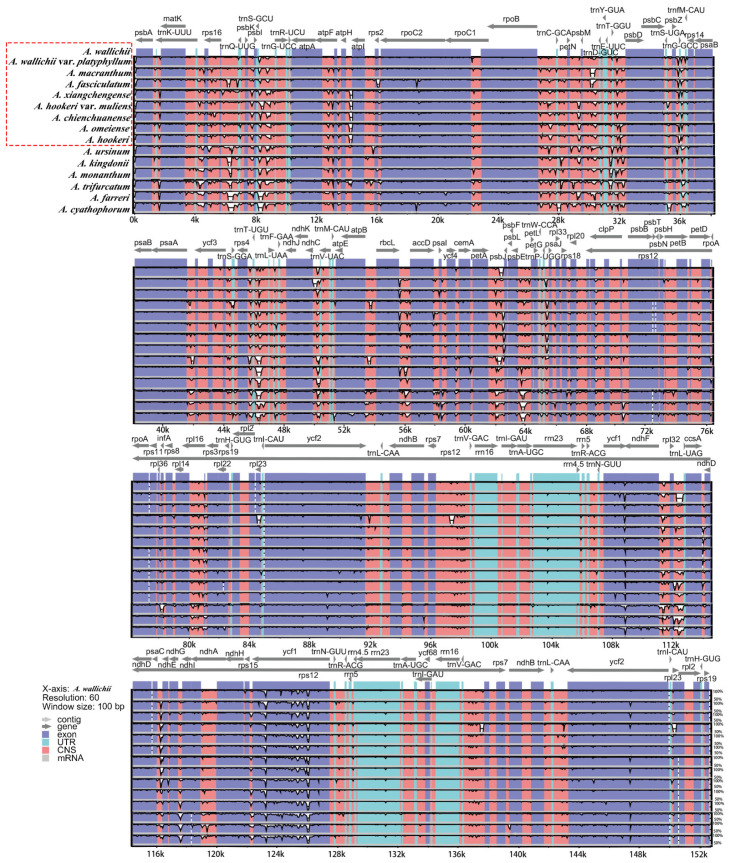
Figure 8.
VISTA-based sequence identity plot of 15 chloroplast genomes with A. wallichii as a reference. The percentage identity ranging from 50 to 100% is represented by the vertical scale. Coding and non-coding regions are colored in purple and pink, respectively. Box in red is for sect. Bromatorrhiza species.

