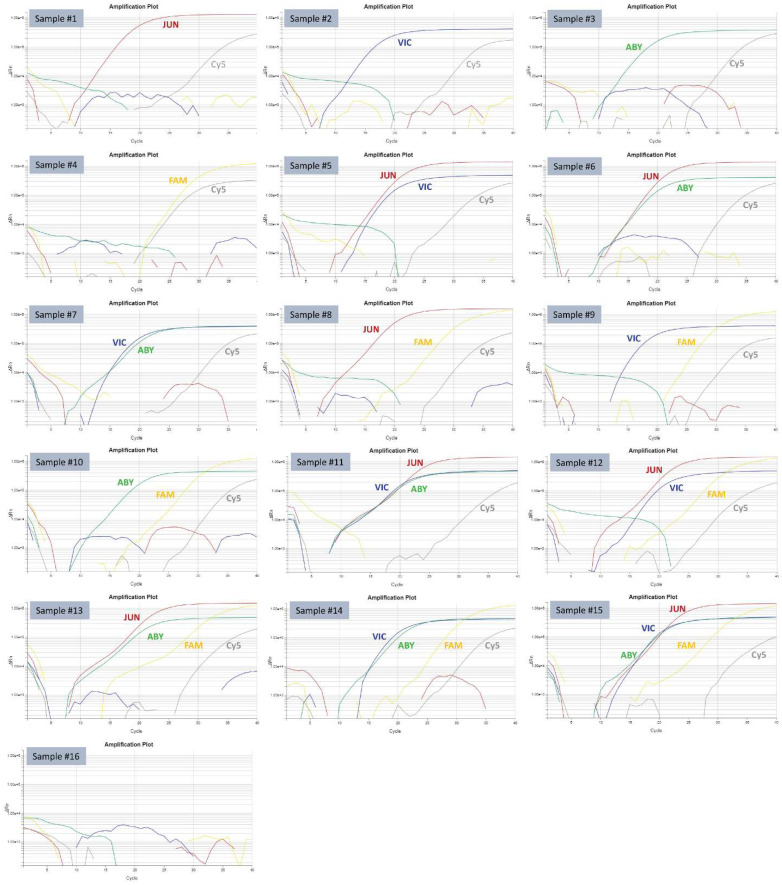
Figure 1.
Amplification plots of 16 samples tested by the PEDV/PDCoV/TGEV/SADS-CoV/XIPC 5-plex PCR. The amplification curves corresponding to each fluorescence dye (JUN, VIC, ABY, FAM, and Cy5) are labeled accordingly. The identities of the samples #1–#16 are denoted in Table 4.

