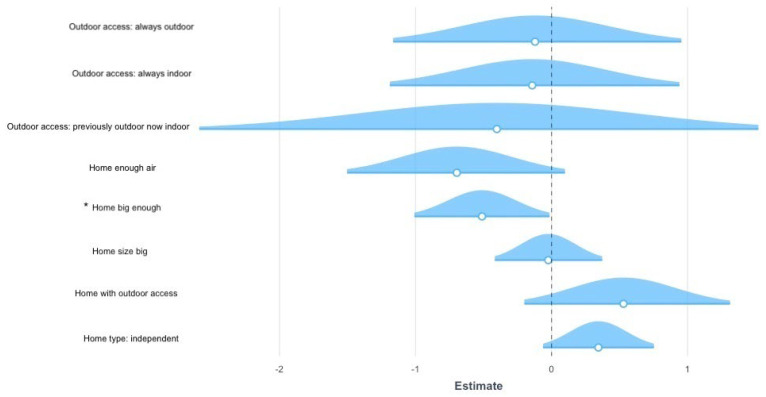
Figure 4.
Results of the ordinal regression on aggression towards familiar cats. The graph represents the estimates (β) and standard errors (s.e.) for the significant models explaining the variance in the aggression towards familiar cats during COVID-19 confinement. The dotted line represents the intercept, the geometrical figures represent the estimates and the coloured shadows represent the standard errors. When the response options were categorical, rather than binary or continuous, the reported parameters are compared against the reference parameter for each variable: previously indoor and now outdoor for the outdoor access, flat for the home type. Significant comparisons are indicated with an asterisk. Positive estimate values are on the right, whereas negative estimate values are on the left.

