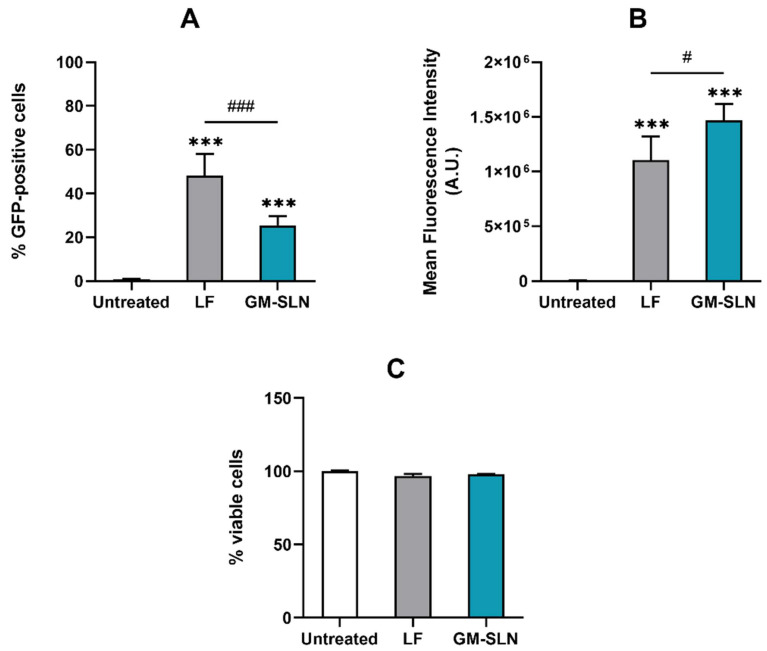
Figure 8.
Transfection efficacy and cell viability analysis by flow cytometry in Hep G2 cells 3 days post-transfection. (A) Percentage of GFP-positive cells. The percentage of GFP-positive cells corresponds to fluorescent GFP cells over total cells. (B) Mean fluorescence intensity. Mean intensity of fluorescence indicates the average intensity of fluorescence per labeled cell. (C) Percentage of viable cells. Results are shown as the mean ± standard deviation (n = 3). Statistical significance: *** p < 0.001 in comparison to untreated cells. # p < 0.05, ### p < 0.001. A.U.: arbitrary unit. GFP: green fluorescent protein. GM-SLN: galactomannan SLN-based vector. LF: Lipofectamine® 2000.

