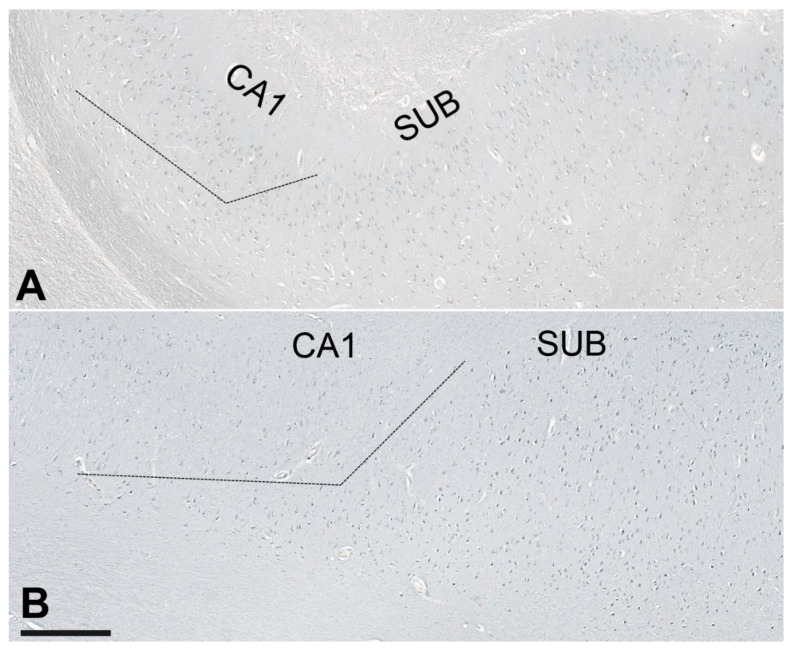
Figure 9.
Immunostaining of ASC in the subiculum in control (A, case HC5) and AD brain (B, case AD2). The dashed line is a provisional border between the CA1 field and subiculum. The difference in the number of NLRP1-immunoreactive neurons between the HC and AD groups in the subiculum was statistically significant (see Figure 2). Scale bar (same for A and B) = 500 µm.

