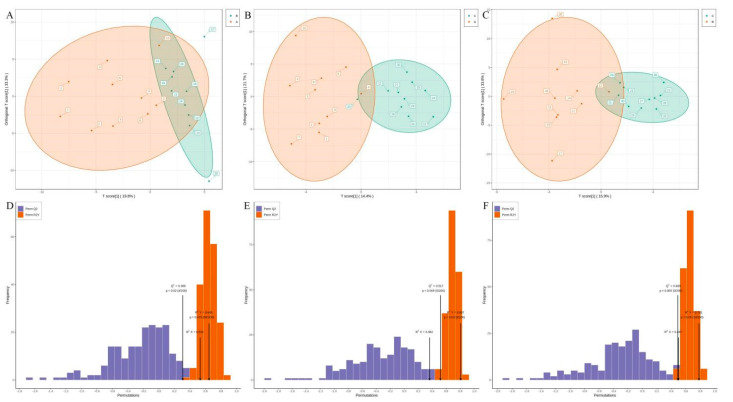
Figure 4.
Summary and validation of the OPLS-DA models. (A–C) OPLS-DA score plots for Group A versus Group B (A), Group A versus Group C (B), and Group B versus Group C (C). The abscissa represents the predicted principal component and the ordinate represents the orthogonal principal component. (D–F) OPLS-DA permutation test plot for Group A versus Group B (D), Group A versus Group C (E), and Group B versus Group C (F). The abscissa represents model accuracy, and the ordinate represents the frequency of model classification effect.

