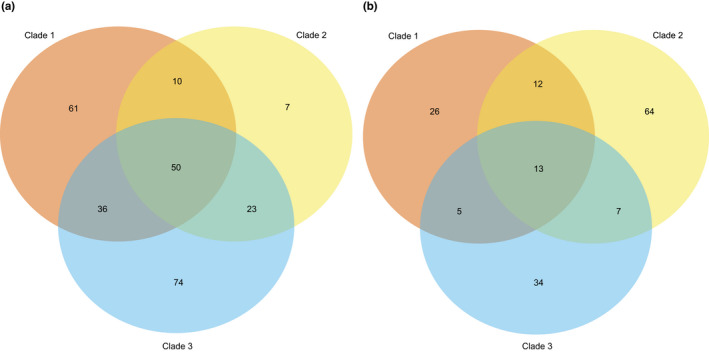
FIGURE 2.

Venn diagram showing patterns of purifying and diversifying selection in the clade‐specific core genomes of the three largest Bacillus cereus sensu lato (Bc sl) clades. Numbers indicate the total number of genes that are experiencing selection (either purifying or diversifying), and location of numbers indicates whether the genes are experiencing selection in one clade or in multiple clades. (a) Genes under purifying selection (n = 261). (b) Genes under diversifying selection (n = 161)
