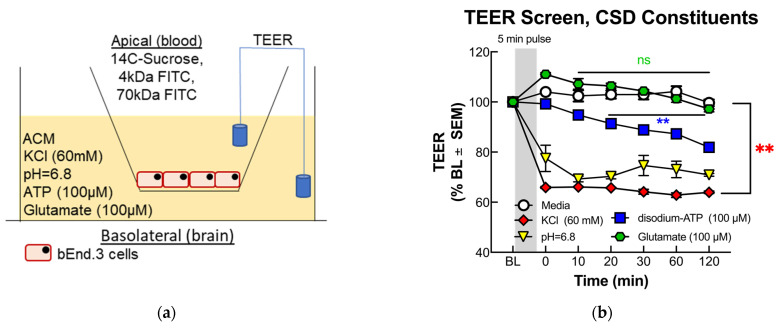
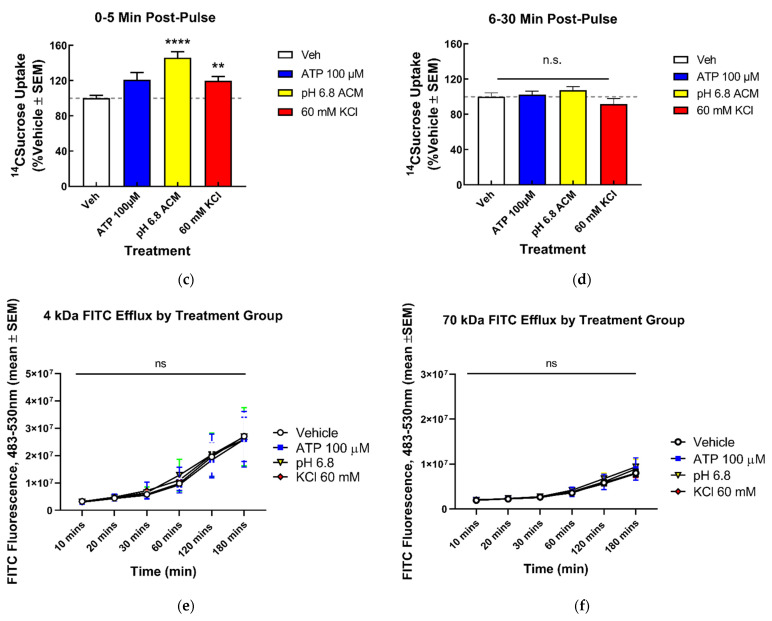
Figure 1.
Screening and functional consequences on BEB following treatment with pronociceptive substances released during CSD. (a) Cross-sectional diagram of Transwell culture and TEER assay. (b) Both 60 mM KCl and acidified pH induced a rapid, significant drop in TEER following abluminal treatment, while 100 μM ATP demonstrated a gradual TEER drop, and 100 μM glutamate had no significant effect (60 mM KCl vs. Veh: mean of differences: −32.5 ± 5.463, ** p = 0.0010; n = 3/4: glutamate vs. Veh: mean of differences = 1.612 ± 1.403, p = 0.2941, n = 3: pH = 6.8 vs. Veh: mean of differences = −25.77 ± 4.392, ** p = 0.0011, n = 3/4: 100 μM ATP vs. Veh: mean of differences = −10.39 ± 2.483, ** p = 0.0058, n = 3: all data analyzed with two-tailed paired t-test ± SEM). Abluminal 14C-sucrose uptake by treatment group at (c) 5 and (d) 30 min post treatment. Both 60 mM KCl and acidified pH induced significant increase in 14C-sucrose uptake 5 min post-treatment, (Veh vs. pH = 6.8: mean difference = −52.29; 95% CI (−73.35, −31.22) **** p = < 0.0001, n = 8: Veh vs. 60 mM KCl: mean difference = −27.21; 95% CI (−48.27, −6.139) ** p = 0.009, n = 8; analyzed by one-way ANOVA with Dunnett’s multiple comparison test post hoc F(3,29) = 12.79), which ablated after 30 min (Veh vs. pH = 6.8: mean difference = −10.15; CI (−29.65, 9.356) p = 0.4440, n = 8: Veh vs. 60 mM KCl: mean difference = −7.825; 95% CI (−7.825, 30.02) p = 0.3499, n = 9, ns = no significance: analyzed by one-way ANOVA with Dunnett’s multiple comparison test post hoc. F(3,31) = 2.554). (e) Both 4 and (f) 70 kDa FITC uptake assays demonstrated no significant difference between treatments over a 180 min time course, suggesting magnitude of BEB breach is both <4 kDa (Veh vs. pH = 6.8: mean difference = −698,151; 95% CI (−14,413,073, 13,016,771) p = 0.9984, n = 4: Veh vs. 60 mM KCl: mean difference = −395,731 95% CI (−14,110,653, 13,319,191) p = 0.9997, n = 4: analyzed by one-way ANOVA with Dunnett’s multiple comparison test post hoc; F(3,20) = 0.2069, ns = no significance) and 70 kDa (Veh vs. pH = 6.8: mean difference = −524,392; 95% CI (−4,332,275, 3,283,491) p = 0.9713, n = 4: Veh vs. 60 mM KCl: mean difference = 38,393; 95% CI (−3,769,490, 3,846,276) p = 0.9999, n = 4: analyzed by one-way ANOVA with Dunnett’s multiple comparison test post hoc; F(3,20) = 0.06026, n.s. = no significance). The green line in (e) is an error bar for the pH data.


