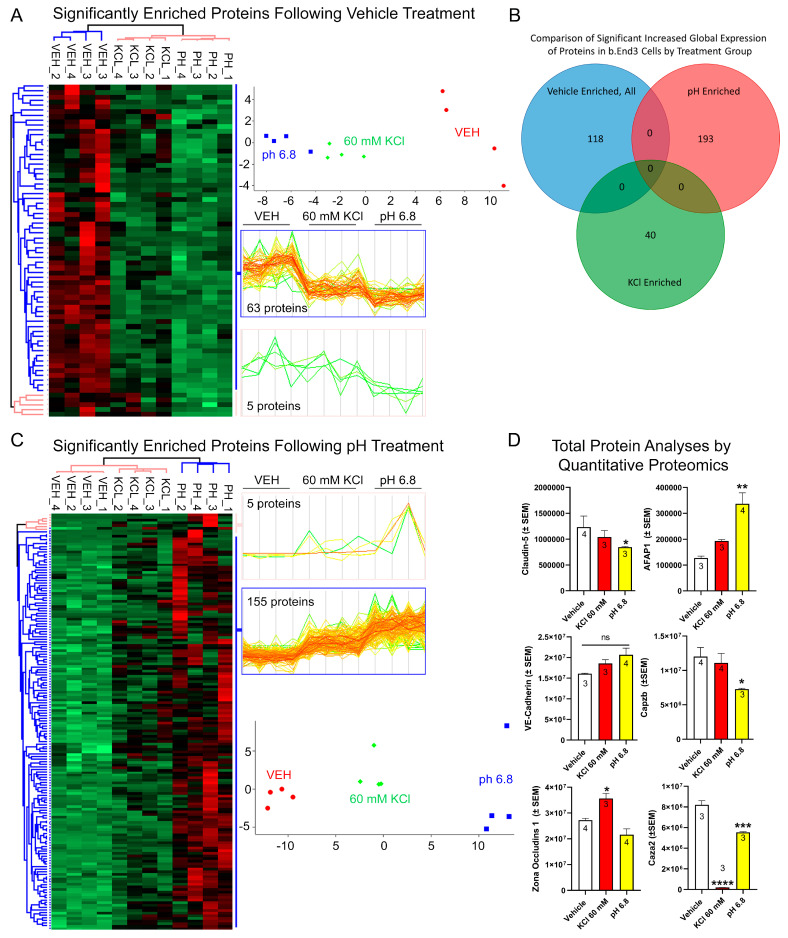
Figure 4.
Global unlabeled quantitative proteomics analysis of b.End3 endothelial cells demonstrate convergent effect of independent mechanisms resulting from vehicle, 60 mM KCl, and media buffered to pH = 6.8 on expression of TJ and cytoskeletal proteins. (A) Unbiased hierarchal clustering and principal component analysis (PCA) of the 68 proteins enriched following vehicle treatment compared to 60 mM KCl and acidified pH obtained from 3-way ANOVA analysis (α = 0.05) of global proteome data illustrate consistency of protein expression between biological samples (n = 4 per treatment group) clustering accordingly into vehicle, 60 mM KCl, or pH = 6.8 buffered media treatment groups; heat map visualizes individual protein clustering. (B) Venn diagram comparing protein expression enrichment by treatment group, absence of proteins enriched by multiple treatment groups indicates unrelated mechanisms affecting protein expression for each treatment. (C) Unbiased hierarchal clustering and principal component analysis (PCA) of the 160 proteins enriched following acidified pH treatment compared to 60 mM KCl and vehicle obtained from 3-way ANOVA analysis (α = 0.05) of global proteome data illustrate consistency of protein expression between biological samples (n = 4 per treatment group) clustering accordingly into vehicle, 60 mM KCl, or pH = 6.8 buffered media treatment groups; heat map visualizes individual protein clustering. (D) Plots of TJ proteins CL-5, VE-CAD, ZO-1 and actin maintenance proteins AFAP1, Caza2, and Cap2b showing individual changes in total enrichment post KCl and acidified pH exposure, showing highly variable effects on total enrichment of structural proteins unique to each treatment and protein, indicative of a synergistic mechanism impairing barrier function summed from combined independent effects of each treatment (CL-5): vehicle vs. 60 mM KCl; mean difference = 192,265; 95% CI (−441,412, 825,941), p = 0.6393, n = 4/3: vehicle vs. pH = 6.8; mean difference = 387,221; 95% CI (−246,455, 1,020,898), p = 0.2286, n = 4/3; F(2,7) = 1.972, p = 0.3002: VE-CAD: vehicle vs. 60 mM KCl; mean difference = −2,479,175; 95% CI (−7,634,858, 2,676,509), p = 0.3617, n = 4/3: vehicle vs. pH = 6.8; mean difference = −4,557,060; 95% CI (−9,379,760, 265,640), p = 0.0946, n = 4/3; F(2,7) = 6.836, p = 0.0946: ZO-1: vehicle vs. 60 mM KCl; mean difference = −8,370,223; 95% CI (−15,234,252, −1,506,194), * p = 0.0207, ns = no significance; n = 4/3: vehicle vs. pH = 6.8; mean difference = −5,625,431; 95% CI (−729,425, 11,980,288), p = 0.0797, n = 4/3; F(2, 8) = 1.271, p = 0.0020: AFAP1: vehicle vs. 60 mM KCl; mean difference = −65,938; 95% CI (−192,646, 60,769) p = 0.3147, n = 4/3: vehicle vs. pH = 6.8; mean difference = −209,238; 95% CI (−327,762, −90714), ** p = 0.0034, n = 4/3; F(2, 7) = 58.55, p = 0.0047: Caza2: vehicle vs. 60 mM KCl; mean difference = 8,010,441; 95% CI (−6,881,290, 9,139,593) **** p = <0.0001, n = 3: vehicle vs. pH = 6.8; mean difference = 2,654,703; 95% CI (1,525,552, 3,783,855), *** p = 0.0006, n = 3; F(2, 7) = 194.7, p = <0.0001: Caz2b: vehicle vs. 60 mM KCl; mean difference = 911,433; 95% CI (−3,489,104, 5,311,970) p = 0.8099, n = 4/3: vehicle vs. pH = 6.8; mean difference = 4733908; 95% CI (−19,215, 9,487,031), p = 0.0508, n = 4/3; F(2,8) = 3.857, p = 0.0672. Analyzed by one-way ANOVA with Dunnett’s multiple comparison test post hoc.

