Figure 7.
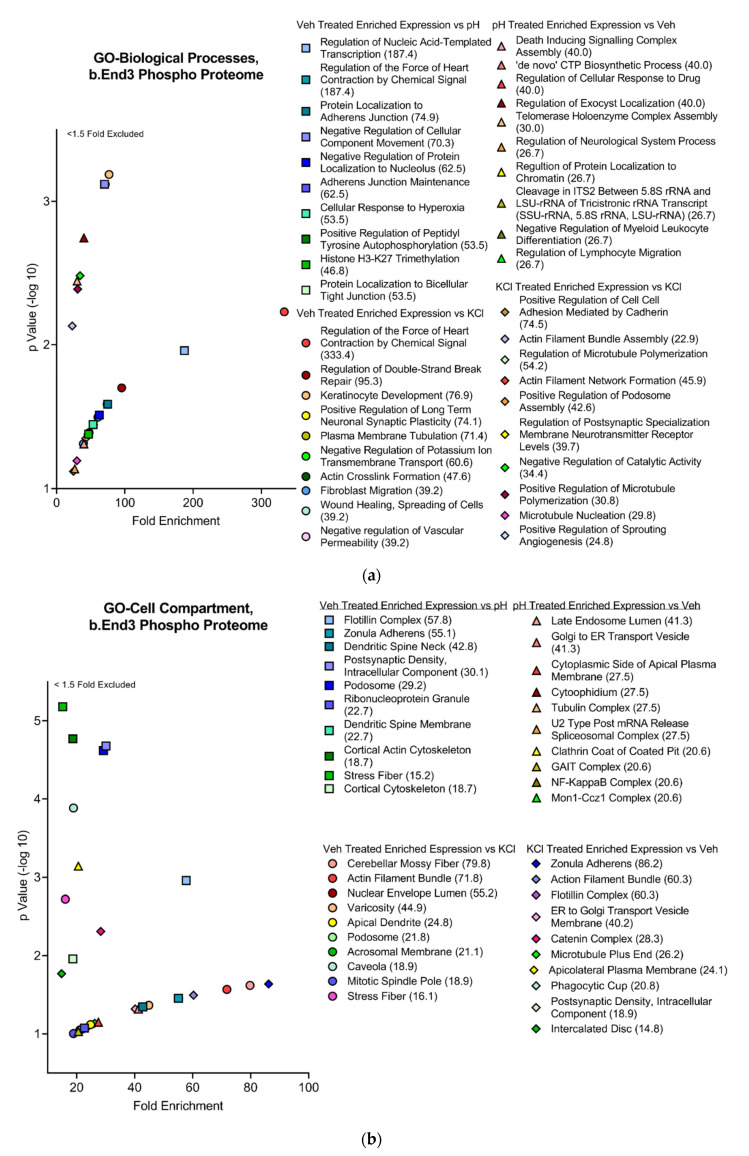
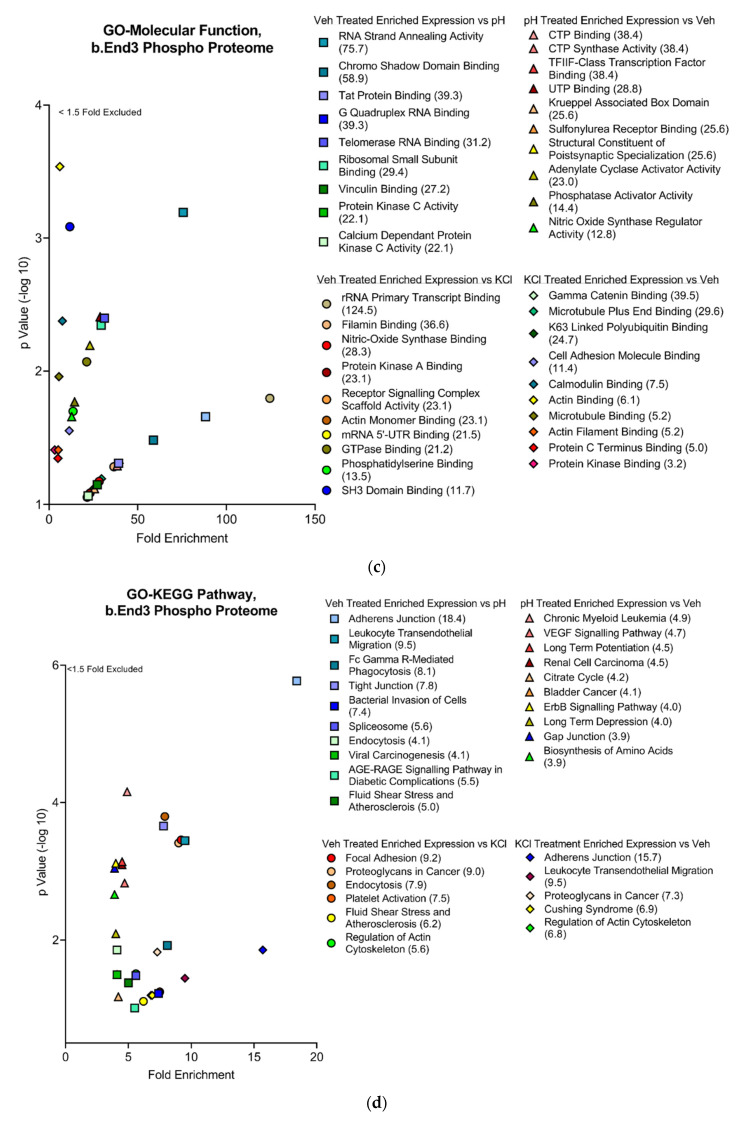
Global phosphorylation-enriched proteins separated by treatment group and represented by scatterplots comparing fold enrichment score (FE) against −Log10 transformed p-values. Top ten cellular processes and pathways assessed by total fold enrichment score queried through the three GO databases; (a) BP, (b) CC, (c) MF, and (d) KEGG pathway databases demonstrate highly varied upstream protein PTM modifications unique to each treatment group with convergence of effect observed in proteins associated with maintenance of structural integrity of the cell. n = 4 per treatment group.


