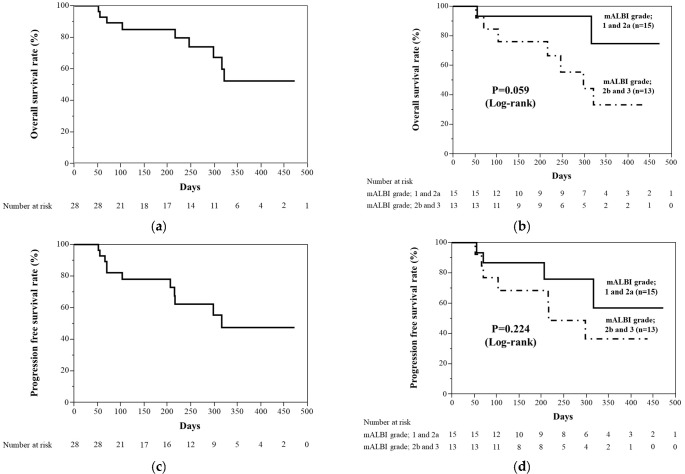
Figure 2.
Kaplan–Meier curves for overall survival rate and progression-free survival rate. (a) Overall survival rate. Median overall survival rate was not evaluated. (b) Overall survival rates between the mALBI grade 1 plus 2a group and mALBI grade 2b plus 3 group were not significantly different (p = 0.059). (c) Progression-free survival rate. Median progression-free survival was 316 days. (d) Progression-free survival rates between mALBI grade 1 plus 2a group and mALBI grade 2b plus 3 group were not significantly different (p = 0.224).

