
Figure 2.
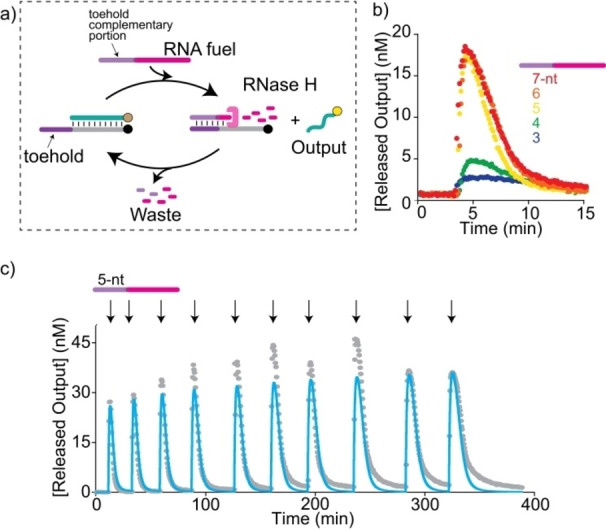
a) Enzymatically‐driven dissipative strand displacement reaction. b) Time trajectories of the dissipative strand displacement reaction after the addition of 100 nM fuel with different toeholds lengths (3–7 nts). c) Time trajectory showing multiple transient strand‐displacement cycles following repeated addition of the same amount of the RNA fuel strand (100 nM) to a solution containing the preformed duplex (50 nM) and RNase H (15 U mL−1). The fluorescence signal here is reported as [Released Output] (nM), indicating the concentration of the output strand transiently released at each cycle. Experimental values (grey) are shown together with a prediction from a parameterized kinetic model (blue).