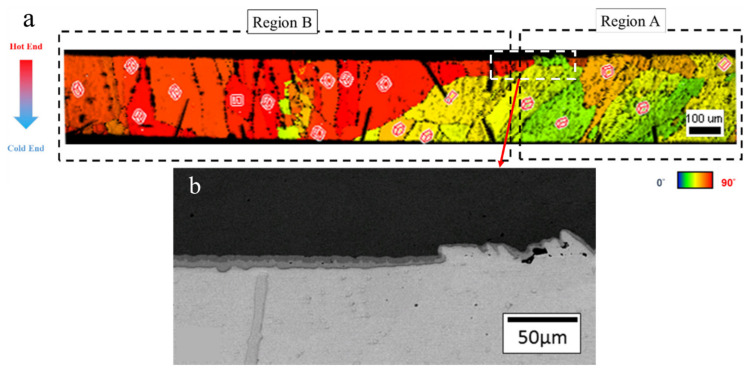
Figure 7.
(a) The orientation map in a solder joint with a solder height of 282 μm after thermomigration. The Sn c-axes in Region A and B are near parallel and vertical to the direction of the thermal gradient, respectively. The boxes in the picture show the crystalline structure of Sn. (b) SEM image of the circled area in the white dashed box of (a). Reprinted with permission from ref. [84]. Copyright 2014 Elsevier.

