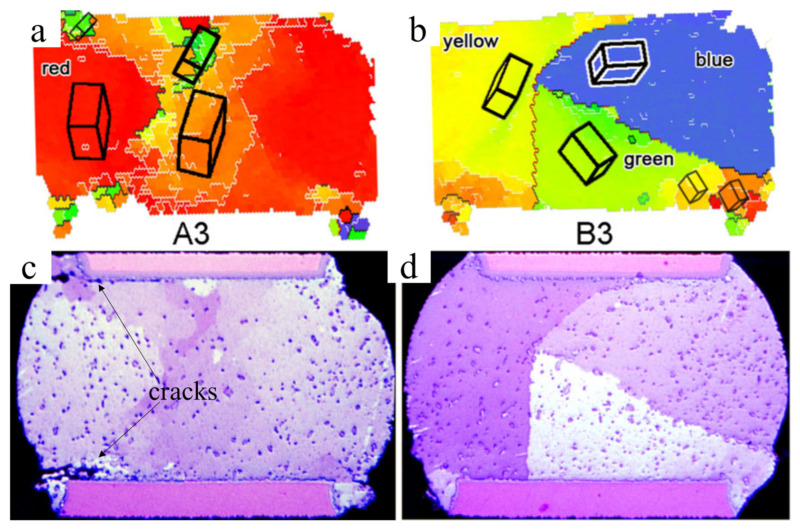
Figure 12.
(a) Sn crystal orientation map of (c) a solder joint with crack propagation after TCT. (b) Sn crystal orientation map of (d) a solder joint without crack propagation. The black boxes show the Sn crystal unit cells in the solders. Reprinted with permission from ref. [99]. Copyright 2011 Springer Nature.

