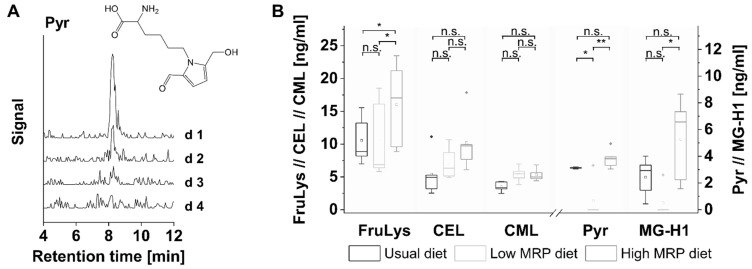
Figure 2.
(A) LC-MS/MS chromatogram of pyrraline (Pyr) in saliva samples of one subject on four consecutive days during low MRP diet; (B) comparison of dietary styles: boxplot of salivary MRP concentrations of five subjects during usual diet, on day 5 of the low MRP diet and on day 5 of the high MRP diet. The box contains 50% of data and includes the mean of the data (demonstrated by the square in the box) and the median (demonstrated by the line in the box). Outliers are indicated by a rhombus. Significance:, ** p < 0.01, * p < 0.05, n.s.—not significant.

