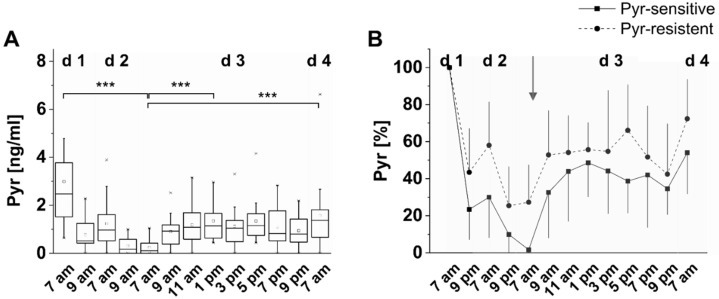
Figure 4.
Interindividual differences in the metabolic transit of 1.2 mg dietary Pyr from food to saliva. (A) Boxplot of salivary Pyr concentrations after a high MRP intervention meal during a three-day low MRP diet of 17 subjects. The box contains 50% of data and includes the mean of the data (demonstrated by the square in the box) and the median (demonstrated by the line in the box). The length of the box, the interquartile range, is equivalent with the variation of the data. The whiskers within plots show a range of 1.5-fold values of the interquartile range. Outliers are indicated by an asterisk. Significance: *** p < 0.001. (B) classification of subjects corresponding to the degree of decrease of salivary Pyr concentration during low MRP diet in two subgroups of “Pyr-sensitive metabolizers”(squares) and “Pyr-non-sensitive metabolizers”(dots). Shown are the mean values with one-sided standard deviation. The arrow indicates the time of intervention.

