
FIGURE 1.
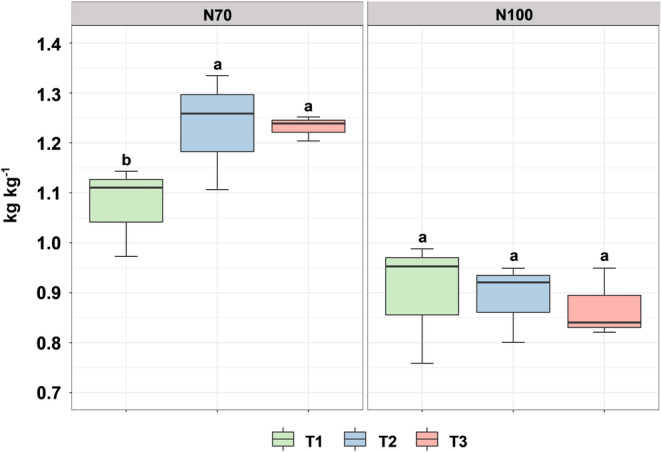
N‐uptake efficiency (NUpE) as affected by the interaction maize treatment (T1: Control; T2: AMF‐based product; T3: B. megaterium. PGPR formulation) × N‐fertilization (70: 70% N‐fertilization and 100: 100% N‐fertilization). Letters indicate significant differences between T levels (p < 0.05), within the same N‐fertilization level